

When Apple first launched App Tracking Transparency (ATT) on iOS14, performance marketing changed overnight. If you relied on user-level tracking to measure results, you likely saw attribution gaps widen and visibility decline.
In fact, untrackable traffic rose by 55% shortly after ATT. This shift accelerated cookieless measurement and weakened traditional targeting models.
As privacy regulations expand and cookies disappear, platform-reported metrics no longer provide reliable clarity. If you are scaling paid media, this uncertainty directly affects your CAC, forecasting, and profitability.
Here, Geo-Lift testing offers a more dependable alternative.
Instead of tracking individuals, you compare controlled geographic markets through aggregated data. As a result, you gain clearer insight into what works, where to allocate budget, and how to scale with confidence in a privacy-first environment.
In this guide, you will learn how geo-lift testing works, when you should run it, and how to structure a clean experiment.
P.S. Still relying on platform attribution while tracking signals disappear? If you are unsure whether your paid media truly drives incremental revenue, 9AM can help you build a geo-lift framework that brings clarity to your scaling decisions.
TL;DR
- A Geo-Lift test measures true incremental business impact (causality) and isn’t a purely blind comparison.
- Monitoring aggregated geographic data rather than sensitive user-level data helps ease privacy concerns.
- Rigorous statistical planning, such as Power Analysis or MDE, is necessary to avoid false-positive campaign results.
- Geo-Lift allows businesses to still validate their local signals even without relying on last-click attribution.
What is Geo-Lift Testing?
Geo-Lift testing is a measurement method that uses geographically aggregated data for ad testing.
Instead of relying on user-level tracking, you compare performance between regions exposed to ads and regions that are not. This allows you to see whether your campaigns generate conversions that would not have happened otherwise.
Unlike multi-touch attribution, which distributes credit across tracked touchpoints, geo-lift focuses on real-world performance differences between markets. It also differs from marketing mix modeling, which evaluates overall marketing contribution over longer timeframes. Geo-lift concentrates specifically on isolating lift generated by paid media exposure within defined regions.
Geo-Lift Testing vs. Multi-Touch Attribution vs. Marketing Mix Modeling
When you scale paid media, this distinction matters. You need to know whether your spend drives new demand or simply captures conversions that would have occurred anyway. Geo-lift testing gives you that clarity.
How Does Geo-Lift Testing Work?
You begin by selecting comparable geographic markets. Some regions receive advertising exposure, while others remain at baseline or paused spend levels.
You then monitor key performance metrics such as sales or revenue across both groups during the test period. Once the test concludes, you compare performance differences between the exposed and control regions.
If exposed markets show a measurable lift relative to controls, you can attribute that difference to advertising impact. This gives you a clearer view of whether your campaigns generate new demand or simply shift existing conversions.
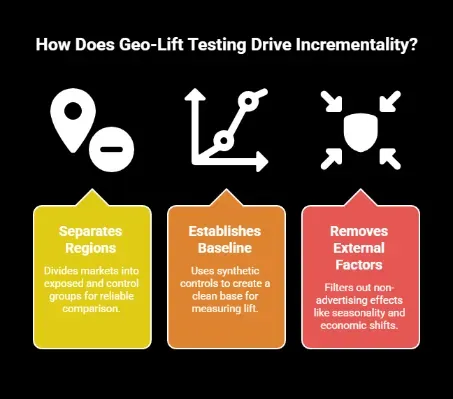
How Does Geo-Lift Testing Drive Incrementality?
Geo-lift testing drives incrementality by isolating the direct impact of advertising from background demand. Instead of assuming performance comes from media exposure, you compare controlled markets against exposed markets to identify measurable lift.
This allows you to quantify how much new revenue your campaigns actually generate.
1. Separates Exposed and Control Regions
You divide comparable markets into exposed and control groups. Exposed regions receive advertising, while control regions remain at baseline spend. This structure creates a reliable benchmark for comparison.
Once that benchmark is established, you can observe how sales change when advertising enters the equation. This isolates the average treatment effect and clarifies what happens when audiences receive no paid media exposure.
When a significant share of impressions (56%) never reach the ideal audience, incremental lift becomes uneven across regions. Geo-lift testing helps you identify markets where media generates real impact and avoid allocating budget where lift remains minimal.
2. Establishes a Clean Baseline with Synthetic Controls
Geo-Lift uses synthetic control models that combine zero-ad regions to create the true base for measuring lift. This improves accuracy when perfectly matched markets are difficult to find.
If you start from a clean, untreated base, it allows you to measure the effect of incremental spend more precisely. You can identify which regions justify additional investment and which markets show diminishing returns.
3. Removes Non-Advertising Effects from the Equation
Aside from controlling visibility, Geo-Lift also filters out external factors such as seasonality, economic shifts, or regional demand cycles that affect successful testing.
Marketing can’t change these external factors. However, they can skew your revenue reporting and inflate perceived campaign impact. Some studies estimate that non-advertising factors account for up to 30% of the attributable factors to sales.
Geo-lift testing controls for these variables at the geographic level. This helps separate advertising-driven lift from organic demand trends. When you scale budgets, that clarity protects efficiency and strengthens forecasting.
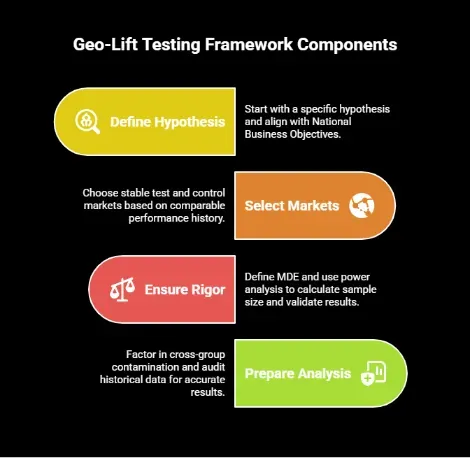
How to Build a Robust Geo-Lift Testing Framework
A strong geo-lift framework starts with clarity and discipline. You need a clear hypothesis, a clean market selection, statistical safeguards, and a structured analysis plan. Without these elements, results become unreliable and scaling decisions become risky.
Below, we have shared the core components that will ensure your geo-lift test produces credible results and actionable insight at scale.
1. Define your Hypothesis and National Business Objectives
Start with a specific hypothesis. Your test should answer a focused question, such as whether a channel drives incremental sales or whether increased spend improves regional profitability.
Once you have your hypothesis, you can align your testing with defined National Business Objectives such as
- Revenue growth
- Contribution margin improvement
- Net profit expansion
This ensures your geo test ties directly to financial outcomes rather than isolated performance metrics.
From what we have seen, teams that skip this alignment usually struggle to translate lift results into actual budget decisions.
2. Select Stable Test and Control Markets
Market selection determines the reliability of your results. Choose regions based on:
- Historical stability
- Sufficient volume
- Comparable demand patterns
Regions with inconsistent demand patterns can distort outcomes and create misleading lift signals.
This is where most teams mess up. They select markets based on convenience or geographic proximity instead of comparable performance history.
We recommend avoiding areas influenced by local events or unusual economic activity. These external factors introduce noise and increase the risk of false positives.
Instead of grouping markets based on geographic proximity, we suggest using clustering methods that match regions based on similar historical performance patterns. This improves comparability and strengthens the integrity of your test design.
3. Ensure Statistical Rigor With Power Analysis and MDE
Before launching the test, define the Minimum Detectable Effect (MDE). It is the smallest increase in sales or conversions your experiment must generate for you to confidently say the lift came from advertising and not from random variation.
This matters because your expected impact must exceed that threshold. If it does not, the experiment may fail to detect meaningful change even if a lift exists.
And to determine whether that lift can be measured, you need the correct sample size. Sample size directly affects your ability to validate results.
Power analysis helps you calculate the required volume and confirm whether your experiment can reliably detect the expected impact before you commit spend.
4. Prepare for Comprehensive Geo-Lift Testing Analysis
Cross-group contamination is something you have to factor in with Geo-Lift. Audiences in control regions may still encounter your ads through social sharing, cross-border activity, or platform delivery spillover.
This can dilute test results if not corrected in time, so you need to remove any contamination-induced anomalies before using forecasting techniques such as time-series modeling.
You can make corrections to data by properly auditing historical KPI information early. This helps you remove any cross-contamination distortions or duplications that can cause false positives and false negatives.
Execute Geo-Lift Testing by Applying Local Signals Effectively
To effectively execute Geo-Lift testing, you should apply local signals in the following ways:
Implement the Marketing Campaign in Treatment Regions
The first step is to start running the marketing campaigns in treatment regions.
Local signals can help determine which strategic media buys will perform well in specific territories and how to allocate your budget based on audience behavior and subtle nuances. This will involve establishing your target parameters and identifying the channels that reach the majority of your intended audience.
You can also target your audience by geo-fencing based on IP addresses or Designated Market Areas. These let you define specific zones for ad visibility rather than relying on randomized data.
Monitor and Collect Data During the Test Period
As the test runs, track performance across both exposed and control markets. Your goal is to link changes in sales or conversions directly to advertising exposure.
This is called Placebo testing, and it's a way to validate your model by running tests like A/A testing on dummy groups.
Here, you effectively use model groups as your test areas before running the real test. You show both groups the same campaign. Your models should show no real difference in conversions between them, but if they do, then you know you’re dealing with external factors.
Investigate factors such as competitor promotions or sudden demand shifts. We have observed that failing to account for these variables mostly leads to overstated lift and flawed scaling decisions.
Careful monitoring throughout the test period ensures that local signals translate into reliable national insight.
How to Quantify Local Lift and Project National Impact
Once your test concludes, the next step is to measure lift accurately and determine whether the results justify a broader rollout. Local validation only matters if it translates into confident national scaling decisions.
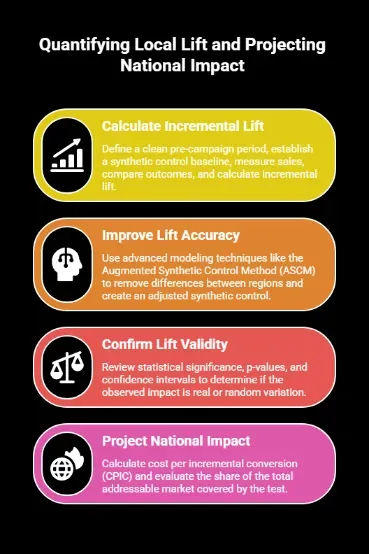
1. Calculate Incremental Lift with Control Comparisons
First, you should calculate the effect of your campaign on the actual sales vs the synthetic Control environment you set up.
To determine the effect, you can;
- Define a clean pre-campaign period where both treatment and control regions operated under similar conditions
- Establish your synthetic control baseline using aggregated untreated regions
- Measure sales or conversion performance during the campaign period in both groups
- Compare post-campaign outcomes in exposed regions against the synthetic control baseline
- Calculate incremental lift based on the performance difference between periods
The confidence interval and p-values can then tell you if the difference in the two periods is significant or just noise.
Confidence intervals and p-values do this by accounting for uncertainty when showing you the true effect of your experiment. This reduces the business risk of unresolved outcomes.
From what we have seen, teams usually stop at surface-level lift percentages. Remember that reliable national projections require statistical confirmation before reallocating budget at scale.
2. Improve Lift Accuracy with Advanced Modeling
Projecting national impact requires more than basic control comparisons. In more complex or volatile markets, advanced modeling techniques can improve accuracy.
One such method is the Augmented Synthetic Control Method (ASCM). It builds on traditional synthetic control modeling by creating a more precise comparison baseline. Traditional models sometimes struggle when treatment and control regions differ in subtle but important ways.
ASCM uses machine learning models to remove any differences between your opposing regions and create an adjusted synthetic control. This leads to a more accurate estimate of incremental lift, particularly when markets are not perfectly matched.
If you have access to advanced data science tools, you can use Bayesian methods like ridge regression to reduce the effect of probability on your tests.
Based on our experience working with different teams, advanced modeling becomes more valuable when scaling tests across multiple regions with uneven performance patterns.
3. Confirm Lift Validity with Statistical Significance
After calculating lift, confirm whether the observed impact reflects a real advertising effect or a random variation.
Start by reviewing statistical significance. P-values and confidence intervals help determine whether the measured lift is reliable.
If the p levels are higher than 5%, there is a good chance the increase in conversions was caused more by external noise and less by your campaign.
Confidence intervals also tell you the range where the lift actually occurred. If the interval is a wide range, say 3% - 20%, then there’s uncertainty on what caused sales.
Make sure you run post-test placebo testing to confirm your model’s validity. This means re-running tests on data from new synthetic control regions. If lift appears in these placebo tests, your model may be overstating impact.
We have noticed that teams usually focus on lift percentages without validating significance. Reliable national projections require both measurable lift and statistical confirmation.
4. Project National Impact by Scaling Local Incremental Economics
Once the local lift is validated, the next step is to translate those results into national impact.
Start by calculating cost per incremental conversion (CPIC). This represents how much you spend to generate one incremental conversion. Divide the total ad spend in the test region by the number of incremental conversions generated.
For example, if you spend $500 and generate 50 incremental conversions, your cost per incremental conversion equals $10.
Next, evaluate what share of the total addressable market your test covered. If your Geo-Lift testing only experimented on 20% of the Total Addressable Market (TAM), you have to multiply your CPIC by 5 (20% divided by 100%). This gives you the national impact of your campaign on conversions (5 x $10 = $50 national CPIC).
But don’t forget about diminishing returns when moving from local to national. Efficiency usually drops as you scale. This means your 1,000th customer is easier to acquire than your 100,000th.
You can apply a scale penalty factor when calculating CPIC to account for the unavoidable rise in costs of your ad nationally.
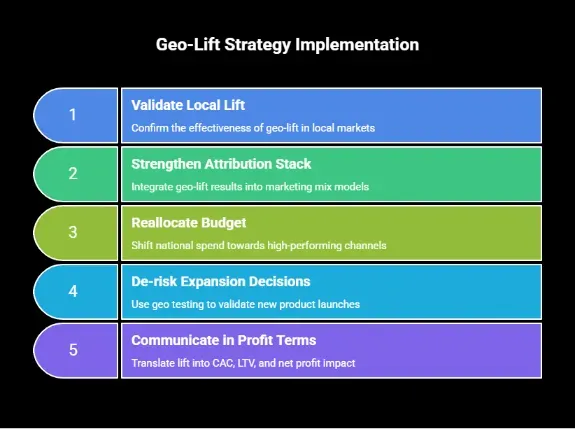
How to Translate Local Insights Into National Strategy With Geo-Lift Testing
Once the local lift is validated, the next step is to convert those findings into national decisions. Below, we have shared the most effective ways to operationalize geo-lift insights at scale:
- Strengthen your attribution stack: Use geo-lift results to anchor marketing mix models and recalibrate multi-touch attribution. Instead of relying only on historical correlations, you ground channel weights in experimentally validated incrementality.
- Reallocate budget based on incremental economics: Shift national spend toward channels that demonstrate measurable incremental lift. Geo data often reveals that some high-attribution channels generate limited new demand. Use validated CPIC and contribution margin impact to guide capital allocation.
- De-risk expansion decisions: Apply geo testing to new product launches, pricing changes, or regional rollouts. Controlled regional pilots allow you to validate incremental revenue before committing to full national investment.
- Communicate in profit terms: Translate lift into CAC, LTV, and net profit impact. In our daily practice, we align geo-lift results directly with profitability models to ensure growth decisions strengthen margins, instead of just volume.
Why Geo-Lift Testing is Your Best Bet in a Privacy-First World
As third-party cookies continue to disappear, user-level tracking and targeting have become highly inaccurate. Attribution models that depend on individual data paths lose accuracy and weaken decision confidence.
This has made Causal Inference all the more important. Causal Inference uses aggregated data to measure true incremental impact while staying compliant with privacy laws.
You get to move from narrow tracking of who clicked what ad to finding which ad actually caused a sale (true causation).
In our daily practice, we have seen that teams relying purely on platform attribution struggle to defend budget decisions when tracking signals weaken. Controlled geo experiments provide defensible, privacy-safe evidence that stands up to both marketing and finance scrutiny.
AI-Augmented Testing plays a useful role here. Automated control selection reduces manual bias and improves comparability between exposed and non-exposed markets. As privacy constraints tighten, that rigor becomes increasingly important for sustainable growth planning.
Read Next: The Cookie-Less Future: How to Win in a Privacy-First World
Scale with Confidence Through Geo-Lift Testing with 9AM
Geo-lift testing positions you for a privacy-first future, but its value goes far beyond compliance.
It allows you to move from interpreting fragmented tracking signals to measuring verified incremental impact. Instead of relying on inferred attribution paths, you use geographic experimentation to identify what truly drives revenue.
Local signals are the safest path to scaling nationally. Not only do they provide a way to test small groups and conserve your budget, but they are also adaptable to national planning with a few adjustments.
However, implementing this level of rigor requires structured experimentation, statistical validation, and integration with CAC and LTV modeling.
A performance-driven agency like 9AM can help you design and operationalize a geo-lift framework aligned with your growth objectives.
Call us today to talk about your analytics and growth strategy.
Frequently Asked Questions
1. What are local signals in marketing, and how are they identified?
Local signals are the different data points and information that marketers use to separate the target market into distinct geographical units. You can identify the local signals for a region with specialized audits that monitor user behavior.
2. What are the key steps involved in conducting a geo-lift test?
The steps in conducting a Geo-Lift test include:
- Define your goals and the type of test
- Audit your KPI data
- Select your test and control regions
- Define your sample size
- Run power analysis to calculate the MDE
- Launch the campaign in test regions and maintain your control areas
- Measure the significance of lift
- Calculate the incremental Return on Ad Spend and adapt nationally.
3. How can geo-lift testing turn local signals into national lift?
Geo-Lift testing allows marketers to see the true incremental impact of ads on profit in a specific region. They can then apply the successful strategies’ local signals to estimate the national lift of running a campaign.
4. How can 9AM help me design a Geo-Lift experiment?
9AM helps you automate the complicated statistical workflows you need for incremental testing. Through optimal marketing selection, multi-touch attribution, and correctly mapping out user journeys, you can use our analytical expertise to begin incrementality testing today.
5. Can 9AM execute the media buys for the test regions?
Yes. Along with advanced analytical models, 9AM also offers media buying services that let you run multi-channel tests across the affected regions. Their media buying strategy also lets you identify the regions with positive causal inference and scale those creatives for profit.
Appendix
- https://www.forbes.com/councils/forbesbusinesscouncil/2022/08/22/how-does-apples-app-tracking-transparency-framework-affect-advertisers/
- https://www.ftc.gov/system/files/ftc_gov/pdf/3-Skiera-Economic-Impact-of-Opt-in-versus-Opt-out-Requirements-for-Personal-Data-Usage.pdf
- https://www.marketingevolution.com/the-waste-in-advertising-stats-and-solutions-of-misattribution
- https://www.prnewswire.com/news-releases/analytic-partners-reveals-brand-messaging-will-win-the-most-customers-in-2023-301689859.html
- https://splitmetrics.com/resources/minimum-detectable-effect-mde/
- https://www.kameleoon.com/blog/power-analysis
- https://www.linkedin.com/pulse/how-augmented-synthetic-controls-reveal-true-marketing-impact-hq2ge
- https://www.sciencedirect.com/topics/social-sciences/bayesian-method
- https://datasciences.utoronto.ca/causal_inference/