

Every growth team eventually gets two CAC numbers that disagree.
Blended CAC looks healthy and says keep going. Paid CAC looks expensive and says slow down. Both are calculated correctly, and both can lead to the wrong budget call.
The pressure behind that disagreement keeps building. Meta reported that its average price per ad rose 9% in 2025, so every paid customer costs more to win, while organic demand quietly keeps blended numbers steady.
This guide defines both metrics, shows where each one misleads, and gives you a step-by-step way to decide whether the next dollar of paid spend is worth it.
P.S. If you'd like help building a CAC model finance will trust, our analytics and measurement team runs CAC, LTV, and payback analysis for growing brands.
TL;DR
- Blended CAC is total acquisition spend divided by all new customers. Paid CAC is paid spend divided by new customers from paid channels.
- Blended CAC tells you what growth the business can afford. Paid CAC tells you what the ad accounts cost.
- Neither should decide a budget increase on its own. Scale on marginal CAC: the cost of the extra customers the last spend increase brought in.
- Paid media can lift organic and branded demand, but attribution can also credit ads for customers who would have bought anyway. Use an incrementality test to establish the true acquisition impact before relying on either CAC average.
- Report both, with the same definitions every month, and add marginal CAC whenever you change budgets.
Our view: we run media buying as a lab and measurement as the loop that decides what earns the next dollar. CAC and MER are the scoreboard. But a scoreboard that only shows averages stops the lab from learning, because averages hide what the last test actually cost. Blended CAC is a fair summary of the business. It's a poor guide to the next budget step, and most scaling mistakes we see start with treating it as one.
What Is Blended CAC?
Blended CAC is your total customer acquisition cost divided by all new customers in the same period, from every channel. Andreessen Horowitz defines it as total acquisition cost divided by total new customers acquired across all channels, paid and organic together.
The formula is simple:
- Blended CAC = total acquisition spend ÷ total new customers
Two choices decide whether the number means anything:
- The numerator. Most teams include paid media and the agency and creative costs tied to it. Some go further and include salaries and tools, which is fully loaded CAC (covered below).
- The denominator. Count only new customers, verified in your store, not orders and not returning buyers.
Blended CAC is good for one question above all: can the business afford its current growth? It ties to the income statement, it can't be inflated by any platform's attribution, and it's the right number for board decks and business-level LTV:CAC.
What Is Paid CAC?
Paid CAC is paid acquisition spend divided by the new customers those paid channels brought in. a16z notes that investors consider paid CAC "more important than blended CAC in evaluating the viability of a business", because blended CAC doesn't show whether paid campaigns are profitable.
- Paid CAC = paid acquisition spend ÷ new customers attributed to paid channels
The hard part is the denominator. It depends on how you attribute customers to paid channels, and the attribution rule you choose changes the answer. Our guide to the last-click attribution problem explains why last-click over-credits the channels that close the sale.
Two rules keep paid CAC honest:
- Count new customers in your store or customer relationship management system, then attribute them. Ad platforms count returning customers as new more often than you'd expect.
- Use one attribution rule and keep it. Changing the rule changes the trend, which makes month-to-month comparisons meaningless.
Paid CAC is good for channel decisions: which platform, campaign, or audience is acquiring customers efficiently.
Blended CAC vs Paid CAC: Key Differences
The key difference is what each metric counts in the denominator. Blended CAC divides spend by every new customer, including those who arrived through organic search, word of mouth, and email. Paid CAC divides only by the customers attributed to paid channels.
| Attribute | Blended CAC | Paid CAC | Marginal CAC |
|---|---|---|---|
| Formula | Total acquisition spend ÷ all new customers | Paid spend ÷ paid-attributed new customers | Change in spend ÷ change in new customers |
| Counts organic customers | Yes | No | Only those the spend increase added |
| Depends on attribution | No | Yes | No |
| Best for | Affordability, board reporting, LTV:CAC | Channel and campaign efficiency | Deciding whether to raise spend |
| How it misleads | Organic demand hides expensive paid growth | Can miss paid-driven demand or credit non-incremental customers | Noisy over short periods |
Here's a worked example.
A brand spends $120,000 on paid acquisition in a month and acquires 3,000 new customers, verified in its store. Its attribution rule credits 1,800 of them to paid channels.
- Blended CAC: $120,000 ÷ 3,000 = $40
- Paid CAC: $120,000 ÷ 1,800 = about $66.67
- Paid-attributed share of new customers: 1,800 ÷ 3,000 = 60%
That share is worth tracking, but it describes attribution, not causation. Here, 60% of new customers are credited to paid channels under the chosen attribution rule. It doesn't establish whether paid advertising influenced the remaining 40%, or whether every paid-attributed customer needed an ad to buy.
Which CAC Metric Should You Use to Scale?
Use marginal CAC to decide whether to scale, with blended CAC as the affordability check and paid CAC as the channel view. Blended and paid CAC are both averages. A budget decision is about the next batch of customers, and only marginal CAC measures that.
Here's the method we use, in six steps:
- Set a CAC ceiling. Work out how much you can pay for a new customer from contribution margin and customer lifetime value over your payback window. Our guide to CAC payback for DTC covers the cash side of that calculation.
- Track blended CAC against the ceiling every week. If blended CAC is already near the ceiling, there's no room to scale on average economics.
- Raise paid spend in steps. Change one budget at a time, and hold it long enough for the step to read cleanly.
- Estimate marginal CAC for each step. Divide the extra spend by the additional new customers attributable to that spend, using store-verified counts and a control or other credible baseline. A simple before-and-after change is only a preliminary estimate.
- Confirm with an incrementality test. Before locking in a bigger budget, run a holdout to check that the extra customers really came from the extra spend.
- Stop or roll back when marginal CAC crosses the ceiling. Blended CAC can still look fine at that point, which is exactly why it can't make this call.
Here's what that looks like with the example brand. Its CAC ceiling is $55, based on the contribution margin a new customer generates within the payback window. The team raises spend from $120,000 to $150,000:
- New customers rise from 3,000 to 3,500, and paid-attributed customers rise from 1,800 to 2,200. For this illustration, assume a controlled test confirms that the extra $30,000 caused all 500 additional new customers.
- Blended CAC moves from $40 to about $42.86. Comfortably under the ceiling.
- Paid CAC moves from $66.67 to about $68.18. Up a little.
- Marginal CAC is $30,000 ÷ 500 = $60. Above the $55 ceiling.
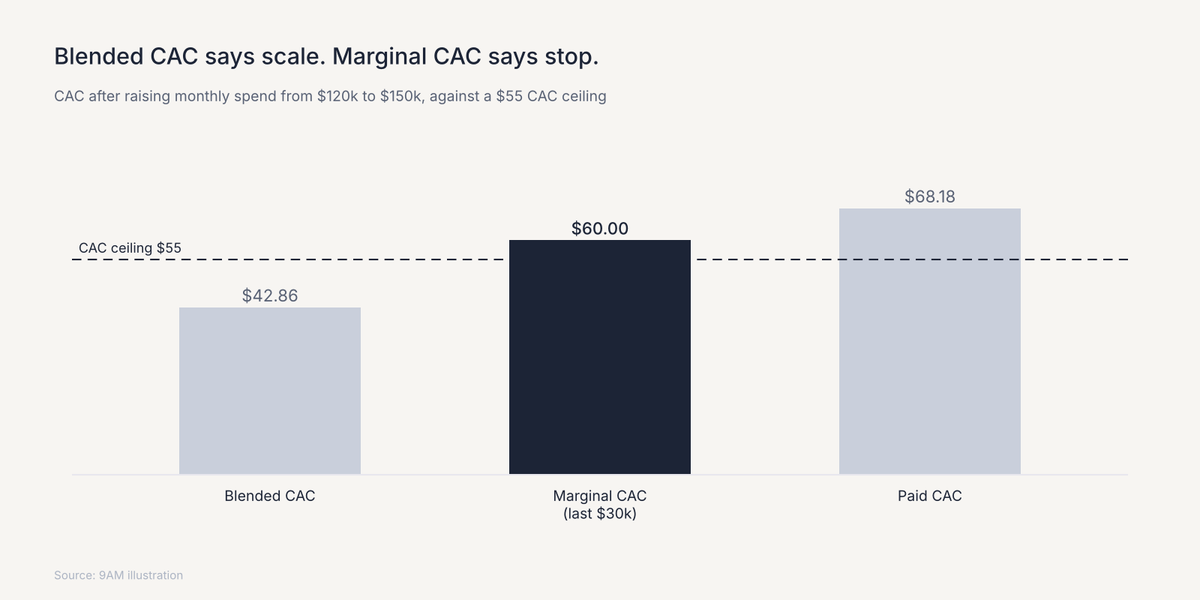
The average numbers say scale.
The marginal number says the last $30,000 bought customers the business can't afford. In our experience, this is the most common way brands overspend: blended CAC keeps reporting a healthy average while each new budget step gets less efficient.
Our playbook on scaling paid media without CAC spikes covers the guardrail metrics to watch during each step.
Use each metric for the decision it's built for:
| Decision | Metric | Why |
|---|---|---|
| Can the business afford its current growth? | Blended CAC | Includes every customer and every dollar |
| Which channel or campaign gets the next dollar? | Paid CAC, by channel | Shows relative efficiency |
| Should we raise total paid spend? | Marginal CAC | Measures only the extra customers bought |
| Is paid spend creating extra demand? | Incrementality test | Separates caused from claimed customers |
| What do we report to the board? | Blended and paid CAC together | Shows both affordability and efficiency |
If you'd rather have a team run those budget steps for you, our media buying team scales spend against a CAC ceiling and reports marginal CAC at every step.
How Paid Media Lifts Organic and Branded Demand
Paid media does create some of the organic demand that lowers blended CAC, but the size of that effect has to be measured, not assumed. a16z puts it plainly: to put weight on blended CAC, "one would need to demonstrate proof" that paid acquisition drives organic acquisition.
The evidence that the effect exists is solid:
- Paid social drives search. In 17 Meta conversion-lift studies across 12 advertisers, Brainlabs found that people who saw the ads made 19% more search visits, and 71% of those extra visits came through organic search.
- Advertising lifts other channels. Analytic Partners' ROI Genome finds that 45% of advertising's impact comes from boosting other channels' ROI.
- Click-based attribution undercounts paid. In Haus's 2025 analysis of 640 Meta experiments, 7-day click attribution under-reported Meta's incremental impact by 15% for DTC brands.
These findings show that click-based attribution can miss some of paid media's impact. They don't establish that paid CAC always overstates acquisition cost: attribution can also credit ads for customers who would have bought without them. Neither every organic customer nor every paid-attributed customer should be assumed to have been caused by paid advertising.
Branded search is the clearest example of why. In Haus's tests, branded search produced significant incremental lift for 82% of brands facing three or more competitors, against 35% with little competition. Much of the time, people searching your brand name would have found you anyway.
What to do: measure the lift directly. Run a holdout or a geo-lift test that compares total new customers, organic included, against a control group. Track paid-attributed share monthly to monitor attribution changes, and use the experiment to estimate how much demand paid advertising actually caused.
Fully Loaded CAC: What to Include in Customer Acquisition Cost
Fully loaded CAC includes every cost of acquiring customers, not only media. It's the most complete version of the customer acquisition cost formula, and the one finance teams usually want for business-level decisions.
| Cost | Paid CAC (media) | Blended CAC | Fully loaded CAC |
|---|---|---|---|
| Paid media spend | Yes | Yes | Yes |
| Agency fees tied to media | Often | Yes | Yes |
| Creative production | Often | Yes | Yes |
| Creator, affiliate, and sales commissions | If paid channel | Yes | Yes |
| Marketing salaries | No | Sometimes | Yes |
| Marketing tools and software | No | Sometimes | Yes |
| First-order discounts | No (sits in margin) | No (sits in margin) | No (sits in margin) |
There's no single correct numerator. There's a correct habit:
- Pick one definition per audience.
- Write it down.
- And keep it fixed.
The media-only version suits channel managers, blended suits growth leads, and fully loaded suits finance and the board.
Discounts are the one cost that shouldn't sit in any CAC numerator. They reduce the revenue of the first order, so they belong in contribution margin, where they lower the CAC ceiling instead.
Why Paid CAC Rises While Blended CAC Looks Flat
Paid CAC usually rises first because media costs and attribution pressure hit paid channels directly, while organic customers keep the blended average steady.
Triple Whale's data across 40,000+ brands shows Meta's median CPM rising 13.24% year over year, from $13.30 to $15.06, for the period ending July 2026.
Rising costs aren't the only cause. Platform reporting can make paid look better or worse than it is. In Haus's 2025 analysis, Advantage+ campaigns over-reported results by about 12 percentage points compared with manual campaigns.
Pro tip: An attribution model audit is the place to start when platform numbers and store numbers drift apart.
A quick first check: compare the new customers each platform claims with the new customers your store recorded for the same period. If platform totals exceed the store total, multiple platforms may be claiming the same new customer. Check cross-platform overlap, attribution windows, modeled conversions, and returning-customer classification before deciding what caused the discrepancy.
Creative is the third cause.
When the same ads run too long, frequency rises and CAC follows, as our piece on the brand tax of scaling without creative explains.
Use this table to diagnose the pattern:
| What you see | Likely cause | What to check |
|---|---|---|
| Paid CAC rising, blended CAC flat | Rising media costs offset by organic growth | Paid-attributed customer share, incrementality results, and CPM trend |
| Paid CAC flat, blended CAC rising | Organic or referral demand falling | Branded search volume and direct traffic |
| Both rising | Creative fatigue or audience saturation | Frequency, CTR, and marginal CAC by step |
| Platform CAC improving, store CAC not | Attribution over-claiming | Platform vs store new-customer counts |
| Blended CAC improving after a sale | Discount-driven customers | First-order margin and repeat rate of the cohort |
How to Report Blended and Paid CAC to Finance and the Board
Report blended and paid CAC together, with fixed definitions and the same time period every month, so the trend means something. Add marginal CAC whenever budgets change.
| Metric | Main audience | Cadence | Window |
|---|---|---|---|
| Blended CAC | Finance, board | Monthly | Calendar month, trailing 3-month average |
| Paid CAC by channel | Growth and media team | Weekly | Trailing 4 weeks |
| Marginal CAC | Growth lead, finance | Each budget step | The step period |
| Fully loaded CAC | Board, investors | Quarterly | Quarter |
Benchmarks help with context but shouldn't set targets. Amp's analysis of Shopify DTC brands puts median CAC at $54, and David Skok's widely quoted LTV:CAC above 3 comes from SaaS, where gross margins run far higher than in ecommerce. Your own CAC ceiling, set from your margins, matters more than either.
Pair CAC with a revenue efficiency metric too. Our guide to marketing efficiency ratio (MER) shows how to track total revenue against total spend, so CAC and MER tell the same story from two angles.
Make Budget Decisions on Marginal CAC with 9AM
Blended CAC and paid CAC both belong in your reporting. Blended shows whether the business can afford its growth, and paid shows which channels are earning their budget. The scaling decision belongs to marginal CAC, checked with an incrementality test before the bigger budget becomes permanent.
That's how we run growth at 9AM.
Media buying, creative, and measurement sit in one team, so every budget step is planned against a CAC ceiling and read against store-verified new customers.
If you'd like us to look at your numbers, book a strategy call. We'll rebuild your blended, paid, and marginal CAC from your own data and show where your last budget increase landed against your ceiling.
FAQs
Should branded search spend count toward paid CAC?
Yes, it's paid spend, so it belongs in the numerator. Report it as its own line too, because branded search often captures demand created elsewhere. Haus found branded search was significantly incremental for only 35% of brands with little competition, so test it before treating it as acquisition.
Do returning customers belong in the CAC denominator?
No. An existing customer who buys again wasn't acquired, so counting them makes CAC look lower than it is. Track repeat revenue separately, in MER or retention reporting.
Is blended CAC still useful for a brand that's almost all paid?
Yes. If nearly all new customers are attributed to paid channels and both metrics include the same costs, blended CAC and paid CAC will be similar. To assess whether brand and word of mouth are contributing more, track customer acquisition sources and use incrementality tests to separate independent demand from demand created by paid advertising.
What window should CAC use when customers take weeks to buy?
Use a trailing window long enough to cover the typical time from first ad view to purchase, often four weeks or more for considered products. Shorter windows punish spend that's still working and make marginal CAC look worse than it is. For choosing which metric leads your reporting, see our guide to choosing a north star metric.