

A media plan can show three convincing channel forecasts and still leave finance with a basic question: how much revenue will the business book if the budget changes? In HubSpot's 2026 survey of more than 1,500 marketers, 73% said their budgets now face more scrutiny.
A platform's expected conversions alone will not settle the budget discussion.
You need a forecast that starts with recorded revenue, estimates the effect of the next increase in spend, and shows when that revenue is likely to arrive. The model should also reveal the point where additional sales cease to cover additional media costs.
TL;DR
- Agree with finance on the revenue measure and forecast period before modeling channels.
- Use the current business revenue at the current spend level as your starting point. Add only the expected change from a proposed budget increase.
- Estimate the return on each new block of spend. Historical average ROAS is a weak guide to the next block.
- Put conversions, closed deals, and repeat purchases in the periods when they are expected to occur.
- Show a range of outcomes and an explicit rule for increasing, holding, or reducing the budget.
Our view at nine.am: a useful forecast is the one that leads to a better budget decision. Media buying tells us where more spend could reach customers. Creative and conversion work affect how much of that demand turns into sales. Measurement tests how much of the result paid media actually caused. Finance needs those pieces expressed in revenue, timing, and contribution after media costs. A forecast that exposes those links gives the team something it can improve as actual results come in.
What should a paid media revenue forecast predict?
Decide which revenue your company will use to judge the plan. An ecommerce business might use net sales after discounts and returns. A subscription company may need first-year booked contract value for one decision and recognized revenue for another. A B2B team may have to forecast both opportunity creation and the deals likely to close later.
Keep the following measures separate in the model:
| Measure | What it represents | What it can decide |
|---|---|---|
| Platform-attributed revenue | Sales credited to ads under a platform's conversion and attribution settings | Campaign diagnostics within that platform |
| Total business revenue | Sales recorded by the commerce system, CRM, or finance team across all sources | The overall revenue plan and reconciliation |
| Incremental revenue | Estimated sales that would not have happened without a specified amount of advertising | Whether an increase in spend is justified |
Consider a hypothetical $300 order.
If the buyer interacted with ads on Meta and TikTok before purchasing, each platform may credit the order under its own reporting rules. Adding two $300 platform figures would produce $600 in attributed revenue, while the business recorded one $300 sale.
Write the forecast's output in one line:
"Expected net revenue for the quarter at the proposed paid budget, compared with expected net revenue at the current budget."
That definition gives marketing and finance one result to review. When you need a channel-level estimate of causal impact, show it as a separate measure with its own evidence.
Why do platform projections differ from business revenue?
Platform tools answer questions about activity inside their systems. That is useful when you are testing campaign budgets, but it does not determine:
- Your company's margin
- Whether a customer would have bought without the ad
- How another channel may influence the same purchase
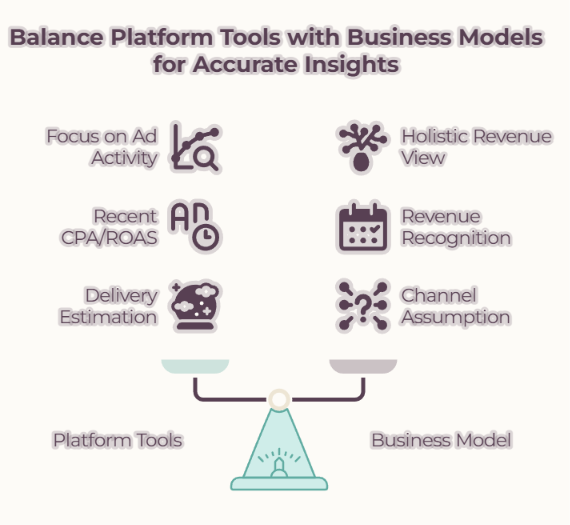
For example, Google's Performance Planner documentation says it simulates recent auctions and bases conversion forecasts on the conversion actions selected for the plan.
The timing of reported results matters too.
Google's conversion delay guidance explains why recent CPA can appear high, and ROAS low before later conversions have been counted. Business revenue can have another delay after the conversion, particularly when leads must become contracts or orders can be returned.
For example, a search campaign spends its monthly budget by month-end.
Some people click late in the month and purchase the next month. The campaign's early performance may change as its reporting window matures, while the company records the purchases later. A forecast that compares those two figures as though they cover the same event date will call the wrong variance.
That’s why we encourage you to label the recent cohort provisional and maintain a clear distinction between ad-interaction date, order date, and recognized-revenue date.
Use platform projections to estimate possible delivery and to challenge your channel assumptions.
Bring the resulting spend and conversion hypotheses into a business model that reconciles to actual revenue. If the historical numbers do not reconcile, inspect the measurement setup before assigning the difference to channel performance. 9AM's attribution model audit covers that diagnostic work in more detail.
What data do you need to forecast paid media revenue?
Start with a period in which the offers, channel mix, and revenue reporting are reasonably comparable to the plan. Keep the original source and owner for each input visible in the model.
| Input | Source of truth | Check before use |
|---|---|---|
| Paid spend by week and channel | Media billing and ad accounts | Include all planned channels and the same dates; identify fees separately |
| Sales, orders, and refunds | Finance or commerce system | Use the agreed gross or net revenue definition consistently |
| New customers or qualified leads | Commerce platform or CRM | Remove duplicates and confirm the stage definition |
| Conversion and sales lag | Mature order or lead cohorts | Avoid treating recent incomplete cohorts as final outcomes |
| Contribution margin | Finance | Use the margin for the expected product or customer mix |
| Price, promotion, and channel changes | Commercial and media plans | Flag periods that cannot serve as an unchanged baseline |
The distinction between gross and net sales is easy to miss in a spreadsheet. Shopify's finance-report definitions, for example, separate gross sales, discounts, returns, and net sales. A forecast based on gross orders needs those adjustments before it is compared with a net revenue target.
Plot total revenue and total paid spend over the same period as an initial check.
The marketing efficiency ratio can reveal whether the business-level relationship is improving, but it cannot assign the change to a specific paid channel. Our guide to marketing efficiency ratio explains how to use that measure alongside campaign ROAS. This article uses the reconciled revenue series as the baseline for a forward plan.
If you lack enough stable history to estimate a channel's response, record the gap.
Use a wider scenario range and specify what the next test must learn. An industry benchmark can be a provisional input; it cannot certify the revenue that a new account will produce.
How do you build a paid media revenue forecast?
Build a row for each month and budget level. The simplest useful model carries five linked calculations: revenue at the current plan, revenue expected from the proposed spend change, timing adjustments, contribution margin, and forecast variance once actuals arrive.
Set a revenue baseline at the current spend level
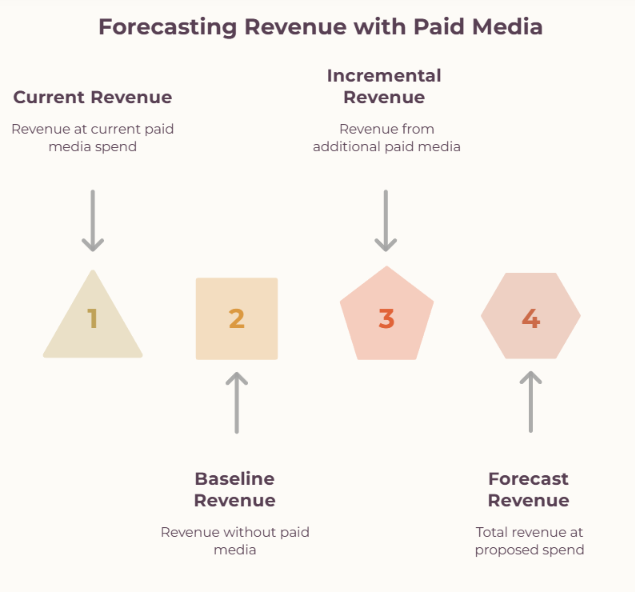
Estimate what the business would sell if the current paid budget continued. Use a comparable recent period, then account for changes already known: seasonality, pricing, distribution, inventory, promotions, or sales capacity. The baseline includes the effect of paid media already running at that spend level.
This definition prevents a common spreadsheet error. If the company is expected to generate $400,000 in monthly net revenue while spending $100,000 on media, $400,000 is the status quo business baseline.
Remember: Do not add a second estimate of revenue from that same $100,000. For a proposed increase, add only the revenue change expected from the additional spend.
Write the calculation directly in the model:
Forecast total revenue at proposed spend = expected revenue at current spend + expected incremental revenue from the spend change.
If you build a different model with a true no-paid-media baseline, state that explicitly. It needs evidence for what revenue would occur without advertising; it is not the same as last month's total revenue.
Estimate the return on the next budget increase
Group historical observations by spend level and examine the additional sales associated with each step. Control as far as practical for:
- Promotions
- Seasonality
- Creative changes
- Demand that would have occurred anyway
With enough data, a response curve can estimate how incremental outcomes change as spend increases. Google's Meridian guidance on response curves and marginal ROI makes the distinction clear: average return describes past investment; marginal return helps decide where the next amount should go.
Do not force a smooth curve through a few noisy observations. Compare the proposed budget with levels you have actually spent. The further the new plan moves outside that range, the more the model must extrapolate. Meridian's documentation flags that risk explicitly.
Here is a fully illustrative ecommerce model.
Assume monthly net revenue is $400,000 at $100,000 of paid spend. The team estimates a 55% contribution margin on additional net sales before media costs. Its response assumptions suggest the next $50,000 could add $120,000 of net revenue, while a further $50,000 could add $70,000.
| Total monthly media spend | Forecast total net revenue | Revenue from the latest spend increase | Contribution after that increase's media cost |
|---|---|---|---|
| $100,000 | $400,000 | Current plan | Current plan |
| $150,000 | $520,000 | $120,000 | $16,000 |
| $200,000 | $590,000 | $70,000 | −$11,500 |
The calculation for the first increase is $120,000 × 55% − $50,000 = $16,000. For the second, it is $70,000 × 55% − 50,000 = -11,500.
Under these assumptions, approve the first increase for further evaluation. The second requires better evidence of demand, stronger conversion, a different product mix, or another strategic reason that finance has agreed to fund.
Note: These numbers illustrate a decision rule; do not take them as category benchmarks.
The response may change when the plan changes. New creative, a landing page improvement, or a new audience can shift conversion economics.
Record the expected effect as a testable assumption. Last quarter's best ROAS is weak evidence for every future spend tier. We cover the execution risks when budgets rise in our guide to scaling paid media.
Put revenue in the month it is likely to arrive
Match each forecasted outcome to its likely date.
- Ecommerce teams should separate orders from net sales after refunds and distinguish first purchases from repeat purchases.
- B2B teams should track lead cohorts through qualification, opportunity, close, and the company's revenue recognition policy. A sale credited to a campaign this month may belong in a later finance period.
For example, picture that an April campaign generates 120 leads. Historically, 30% of comparable leads become sales-qualified and 25% of those qualified leads close. The cohort implies 36 qualified leads and 9 expected deals. At $20,000 of annual contract value per deal, that is $180,000 in expected bookings once the deals close.
It is not $180,000 of April recognized revenue.
- If the typical sales cycle is around 90 days, distribute expected closes across the later periods indicated by past cohorts.
- Finance then applies its policy to the expected contract starts.
- Keep the resulting booked and recognized revenue in separate columns.
- Recent cohorts should be compared with earlier cohorts at the same age. Don’t compare with fully mature annual totals.
Repeat purchases need the same discipline. A first order and a projected second order may both matter to acquisition economics, but they have different timing and evidence. Use observed repeat behavior by customer cohort. If repeat data is unreliable, present first-order revenue in the base case and show later value separately.
Convert revenue into contribution
Apply the expected contribution margin to incremental net revenue, then subtract the extra media spend and any additional variable acquisition costs excluded from that margin. Confirm with finance which costs the margin already includes so the model does not count them twice.
Incremental contribution after media = incremental net revenue × contribution margin − incremental media spend − other incremental costs not already in the margin.
Revenue can rise while this figure falls, as the ecommerce example shows. For subscriptions or B2B, finance may also require a payback view because acquisition spend occurs before later customer payments. This article on CAC payback period covers that longer cash-efficiency question; the revenue forecast should link to its assumptions without treating lifetime value as cash already received.
How do you turn the forecast into budget scenarios?
Change named inputs and show what happens to revenue and contribution. A conservative case should reflect plausible downside evidence, while the upside case should require identifiable improvements. Do not apply an unexplained percentage haircut to a single forecast number.
| Input | Conservative case | Base case | Upside case |
|---|---|---|---|
| Response to added spend | Lower end of comparable observations | Central estimate from comparable periods | Higher response supported by a test or capacity |
| Conversion or close rate | Weak but plausible cohort result | Mature cohort rate | Demonstrated improvement, not a target alone |
| Revenue timing | Slower sales or return settlement | Typical lag | Faster outcome supported by history |
| Margin | Less favorable product or customer mix | Planned mix | Better mix with commercial evidence |
Record the source and owner for each input next to the scenario table. Do not stack every best-case assumption if those outcomes depend on the same unproven campaign change.
Return to the ecommerce example.
The first $50,000 increase has a modeled $16,000 contribution gain; the next has a modeled loss. A sensible request is to approve the first tranche, measure its incremental outcome and margin, and revisit the second.
- If the first tranche underdelivers, the plan names a spending limit in advance.
- If creative or conversion tests materially improve the response, the team can recompute the second tranche from new evidence.
For a new channel with no own-account history, reserve a test allocation. Forecast a range for the learning period, and state the minimum observed conversion quality or incremental return required before it joins the core plan.
How do you test and update the revenue forecast?
Save the approved version of the model. Each review should compare actual results with that original plan and produce a revised outlook for the remaining months. Track which inputs changed before rewriting the total.
| Variance | First check | Possible forecast change |
|---|---|---|
| Spend delivered, but traffic missed | CPC, CPM, reach, auction conditions | Revise expected volume at the remaining budget |
| Traffic arrived, but orders missed | Conversion rate, offer, stock, landing page | Revise order rate and test the cause |
| Lead volume held but revenue missed | Qualification, close rate, cohort age, sales capacity | Change the stage rate or timing after the cohort matures |
| Revenue met plan, but contribution missed | Discounts, returns, product mix, fulfillment cost | Revise margin and budget threshold |
| Platform and finance results diverged | Attribution windows, event quality, reporting dates | Repair measurement; retain separate reporting views |
For example, let’s say spend and clicks match the forecast, but conversion rate falls after a pricing change. Updating the CPC assumption will conceal the cause. Revise the conversion rate for the remaining period, investigate the price response, and retain the original assumption so the team can evaluate its forecasting error later.
When the budget decision depends on causal impact, use a credible incremental measurement method.
- The IAB's incremental measurement guidelines describe experiments and econometric approaches, among others.
- Nielsen's explanation of marketing mix modeling describes its use in assessing investment impact and optimizing budgets.
- Meta's Robyn documentation also describes model calibration against lift and geo-based evidence.
These methods require suitable data and careful interpretation; a spreadsheet forecast does not become causal merely because it fits past sales.
A practical next step is a geographic test where the business has comparable markets and enough signal.
This geo-lift testing guide explains the test design. Feed credible lift results back into the response assumptions, while keeping the test's scope and uncertainty visible.
What should a finance-ready paid media forecast include?
Put the decision on the first page of the budget request. Finance should be able to see:
- The current and proposed spend
- Expected total revenue
- Incremental revenue
- Incremental contribution
- Revenue timing
- The downside case without opening an ad account
Include a short assumption register: which input comes from recorded actuals, which comes from a mature cohort or experiment, and which is still a test hypothesis. Name the person responsible for checking the result and the point at which the team will revisit the budget.
Using the ecommerce example, the recommendation could read:
| "Approve an additional $50,000 in monthly paid media spend for the next test period. At the base response and 55% contribution margin, we forecast $120,000 in additional net revenue and $16,000 in contribution after the extra media cost. Hold the next $50,000 tranche until the observed response and return-adjusted margin support it." |
The request is specific enough to approve, challenge, or revise.
Do not present the illustrative figures as a promise.
In a real request, attach the underlying spend observations, revenue reconciliation, scenario inputs, and review date. The forecast then becomes a record of what the team believed when it made the decision.
Plan your next budget with nine.am
A forecast earns trust when the numbers can be traced to actual revenue and the next spend decision has a clear threshold.
Building one often exposes work beyond the spreadsheet: conversion definitions, channel measurement, sales timing, creative capacity, and the margin available to acquire the next customer.
9AM's analytics and measurement services can help establish the data and cohort view. Our growth strategy work connects that evidence to channel and funnel decisions.
Bring the current spend, revenue series, margin definition, and proposed budget change to the first conversation; they are enough to locate the assumptions that matter most.
Book a call to see what that looks like!
FAQs
How do you forecast a new paid channel with no historical revenue data?
Start with a bounded test and a range based on the closest comparable customer journey. Label borrowed CPC, conversion, and deal-quality inputs as provisional. Set the amount you can spend to learn, then replace the borrowed values with observed results before committing the channel to a quarterly revenue target.
Can blended ROAS be used as a revenue forecast?
Blended ROAS is a useful check on the relationship between total sales and paid spend. It cannot by itself estimate what an additional block of spend will cause, particularly when organic demand, promotions, or channel mix are changing. Use it to challenge the model's total, then inspect marginal response and contribution.
How do you forecast revenue when the sales cycle is longer than the quarter?
Forecast the quarter's lead and opportunity cohorts, then apply mature stage rates and historical time-to-close distributions. Show expected bookings and recognized revenue by later period. Recent cohorts remain provisional until they reach comparable age; treating their current close rate as final will usually distort the plan.
When does a paid media forecast need marketing mix modeling?
Consider MMM when spend spans enough channels, time periods, and variation to support a portfolio-level model, and channel interactions materially affect budget choices. It requires data, diagnostics, and an explicit causal question. A simpler cohort and scenario model may be more useful while the business is still resolving basic revenue definitions or testing a new channel.