

What is a good Performance Max ROAS in 2026?
The answer varies with product category, market, season, and what the campaign counts as a conversion.
This roundup brings together PMax-only account studies, Google's published tests, and broader Google Ads ecommerce data.
Each figure is labeled so a category-wide Google Ads result is not mistaken for a PMax median.
Key Performance Max Statistics for 2026
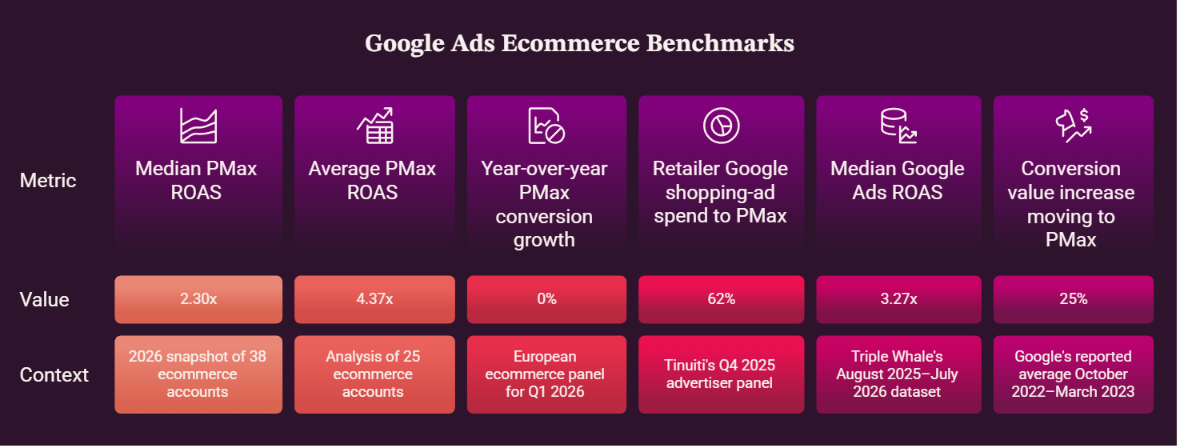
- 2.30x median PMax ROAS: A 2026 snapshot of 38 ecommerce Google Ads accounts, mostly in Germany, Austria, and Switzerland, found this median across the 31 accounts running PMax. The middle half ranged from 1.71x to 3.82x.
- 4.37x average PMax ROAS: In a separate first-party analysis of 25 ecommerce accounts across four countries, PMax averaged 4.37x from January 2025 through September 13, 2026. This is an average, so it’s different than the median in stat 1.
- 0% year-over-year PMax conversion growth in a European ecommerce panel for Q1 2026, after approximately 12% growth in Q4 2025.
- 62% of retailer Google shopping-ad spend went to PMax in Tinuiti's Q4 2025 advertiser panel, among brands running both PMax and Standard Shopping.
- 3.27x median Google Ads ROAS across more than 21,000 ecommerce brands in Triple Whale's August 2025–July 2026 dataset, down 3.54% year over year. This figure spans Google Ads campaign types; it is not PMax-only.
- 25% more conversion value at a similar ROAS was Google's reported average for retail advertisers moving from Standard Shopping to PMax, based on global data from October 2022–March 2023.
Performance Max ROAS Benchmarks by Ecommerce Category
No public source here provides a representative PMax-only ROAS median for every ecommerce category. The table below offers Google Ads-wide category context from the 21,000-brand panel introduced in stat 5. Its six selected rows are not PMax category benchmarks.
| # | Ecommerce category | Median Google Ads ROAS | Median CPA | ROAS change YoY |
|---|---|---|---|---|
| 7 | Sports & Outdoors | 4.35x | $30.42 | +6.49% |
| 8 | Apparel & Accessories | 3.99x | $25.40 | −0.47% |
| 9 | Home & Garden | 3.48x | $38.94 | −2.55% |
| 10 | Food & Beverage | 3.18x | $23.65 | −5.04% |
| 11 | Beauty | 2.81x | $25.39 | −2.13% |
| 12 | Health & Wellness | 2.06x | $34.76 | −8.73% |
- 5.57x median Google Ads ROAS appeared in a different Q2 2026 ecommerce cohort; Sports reached 7.54x and Style & Fashion 7.12x in that panel. Its sample and methodology differ from the category table.
- 4.28x median purchase ROAS was measured across 25 purchase-tracked DTC accounts in an independent 28-brand Google Ads panel covering September 2025–August 2026. This, too, spans campaign types.
- 4.7x to 6.0x median target ROAS: In an analysis of more than 4,000 retail PMax campaigns, the target advertisers set climbed across the study's historical period. Achieved ROAS is a separate measure.
Performance Max CPA, CPC, CTR and Conversion Rate Benchmarks
- $46.10 average PMax CPA in the 25-account ecommerce panel introduced in stat 2. Its average conversion rate was 3.32%, and its CTR was 1.17%; conversion definitions follow the participating accounts.
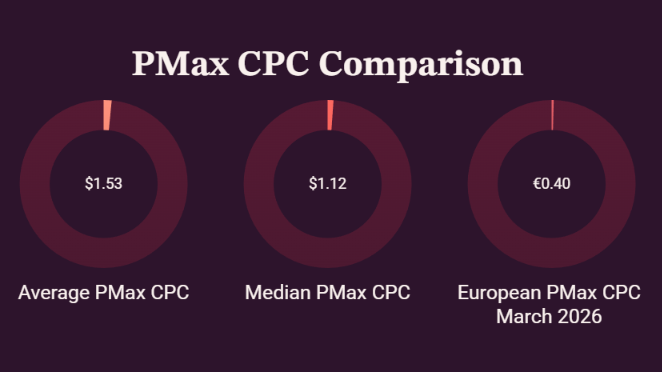
- $1.53 average PMax CPC in the same four-country panel, compared with $1.32 for Standard Shopping and $1.92 for Search. These are campaign-type averages from one panel; do not take them as a controlled test.
- $1.12 median PMax CPC in the 28-brand DTC panel introduced in stat 14; Search was $1.31 and Standard Shopping $1.02. The different sample and aggregation explain why this need not match stat 17.
- €0.40 European PMax CPC in March 2026, after €0.42 in November 2025 and €0.37 in January–February 2026, in the Q1 panel cited in stat 3.
- Approximately 3%–3.5% PMax conversion rate in that European panel during Q1 2026, with CTR around 1.5%–1.6%.
- $28.14 median Google Ads CPA across the broader ecommerce category panel in stat 5, up 9.96% year over year. In the same dataset, median CPM rose 13.34% to $15.35, conversion rate fell 7.02%, and average order value rose 4.31% to $87.65. These are all Google Ads figures.
- $32.47 median cost per purchase across the 25 purchase-tracked DTC accounts in stat 14. Purchase-only CPA and an account's cost per any configured conversion answer different questions.
Performance Max vs Standard Shopping Benchmarks
These studies measure different retailers and time windows; the rows are separate observations.
| # | Original study | PMax versus Standard Shopping | Scope |
|---|---|---|---|
| 23 | Harucon account snapshot (stat 1) | Median ROAS: 2.30x vs 2.30x | 31 PMax and 19 Shopping accounts; May–mid-August 2026 |
| 24 | Tinuiti advertiser panel (stat 4) | PMax ROAS 1% lower | Brands running both; Q4 2025 |
| 25 | Optmyzr's 2025 holiday account study | December ROAS 6.80x vs 6.66x | Accounts running both formats; both CPCs $0.64 |
| 26 | Google retail data (stat 6) | +25% conversion value for switchers at similar ROAS | Global retail advertisers; Oct 2022–Mar 2023 |
- PMax drove 61% of Google Shopping ad sales on 62% of spending in Tinuiti's Q4 2025 dual-format retailer group. The comparable spend and sales shares align with its roughly 1% ROAS gap.
- PMax ROAS fell 13% during the four BFCM 2025 sale days, from 7.62x in the prior week to 6.60x; Standard Shopping fell 22%, from 7.49x to 5.84x, in the holiday account study introduced in stat 25.
Performance Max Brand Traffic Benchmarks
- At least 25% of PMax conversion value came from brand searches in 5 of 11 accounts with PMax value data in the 90-day brand analysis within the Harucon study cited in stat 1. Its observed brand share ranged from 26% to 90% in those five accounts.
- At least 22 of 41 audited ecommerce accounts lacked a brand exclusion in PMax or Shopping in that study's separate audit sample. The audit finding is not a market-wide adoption rate.
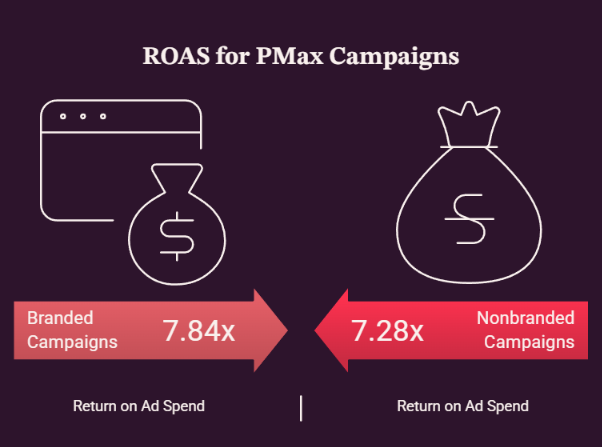
- 7.84x versus 7.28x ROAS for branded and nonbranded PMax campaign groups, respectively, in the December 2025 holiday analysis cited in stat 25. That grouping does not reveal the share of brand queries inside every PMax campaign. See 9AM's guide to PMax brand exclusions for the available controls.
- 1.95x more total revenue and 1.75x more new-customer revenue: In a three-group test by incrementality firm Haus for the brand Caraway, the US was split into thirds: PMax with brand queries, PMax without them, and a no-PMax holdout. PMax with brand queries outperformed PMax without them on both measures. This is a single-brand experiment.
- In the same test, Google's platform reporting overstated the results of PMax with brand by 33%. The brand now uses that factor to calibrate its day-to-day reporting.
- In a Haus meta-analysis of PMax brand-term experiments, every experiment found that excluding brand terms lowered acquisition cost by 19 to 60%. Stats 32 and 34 measure different outcomes, total revenue and cost per new customer, so they do not contradict each other.
Performance Max Setup and Creative Benchmarks
The next four figures are from Google's published PMax best-practices data. Their 2022–2023 measurement windows are part of each result; they are platform findings that have not been updated in the meantime.
- +9% ROAS and −7% new-customer acquisition cost on average for advertisers using New Customer Value Mode in Google's global, all-vertical A/B tests from October 2022–April 2023. The new-customer ratio rose 5%.
- +12% total conversions on average for PMax advertisers adding at least one video asset, according to Google's November 2022 internal data.
- +20% YouTube conversions for PMax advertisers using horizontal, vertical, and square videos versus horizontal video alone in Google's November 2022 internal data. This is a YouTube-within-PMax measure.
- More than +9% conversions or conversion value at similar CPA or ROAS for PMax campaigns using Final URL expansion in Google's global February–April 2023 data.
- +6% median conversions or conversion value at similar CPA or ROAS when PMax asset-group Ad Strength improved from Poor to Excellent, in Google's Q4 2024 data.
- 90% median feed-based cost share in the retail PMax study introduced in stat 15; its typical range was 74%–97%. This is the share of PMax cost attributable to feed-based ads in that sample.
Performance Max vs Search Campaign Overlap Benchmarks
Performance Max shares auctions with Search campaigns, so an account's reported ROAS depends partly on what its other campaigns are doing. The Adalysis study covers non-retail accounts only, and the Optmyzr samples mix ecommerce and lead generation, so treat all four figures as directional for ecommerce.
- Adalysis analyzed more than 3,300 non-retail PMax campaigns and about 1.2 million search terms. It found that almost half of PMax search terms can show ads from either a Search or a PMax campaign.
- 84.18% of overlapping terms favored Search on conversion rate. In the same Adalysis dataset, Search also had the higher CTR 65% of the time. The study does not show which campaign type drove incremental sales.
- 56.29% of 5,768 Search campaigns showed search-term overlap with PMax in Optmyzr's February 2025 review of 503 accounts, including overlap on exact match keywords. The sample mixes account types, and overlap alone does not prove cannibalization.
- 82% of advertisers ran PMax alongside other campaign types in Optmyzr's study of 9,199 accounts and 24,702 campaigns. That is why credit-sharing between campaigns matters when reading any account's ROAS. The sample combines ecommerce and lead generation accounts.
9AM Google Ads Performance Statistics
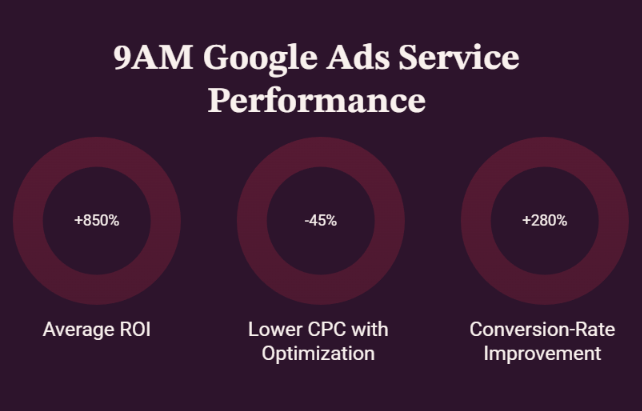
The next figures are published by 9AM for its broader Google Ads work. The service page does not provide a PMax-only sample or measurement period, so they are agency-reported Google Ads figures.
- 8.5x average ROI is 9AM's published Google Ads service figure.
- The page also reports 45% lower CPC with optimization.
- Our clients experienced an average 280% conversion-rate improvement.
How to Set a Performance Max ROAS Target for Your Ecommerce Category (5 Steps)
Benchmarks show where the market sits. These five steps turn the figures above into a target your margins can support.
1. Calculate your break-even ROAS floor. Work out contribution margin by product group and divide 1 by that margin. At a 40% margin, break-even is 2.5x, and the profit buffer the business needs goes on top. That floor can sit above a market figure: 2.5x is higher than the 2.30x median PMax ROAS in stat 1, and the 2.06x Health & Wellness median in stat 12 is lower again.
2. Check category context without mixing datasets. Compare your account's Google Ads performance with the category table, then keep PMax separate using PMax-only samples such as stats 1 and 2. Match the market, product set, and season: in stat 28, PMax ROAS fell 13% during the four BFCM 2025 sale days.
3. Separate brand from non-brand and new from existing customers. Do this wherever reporting permits. Brand traffic can carry much of the result: at least a quarter of PMax conversion value came from brand searches in five of 11 accounts (stat 29). Excluding brand does not have the same effect everywhere. The Haus results show higher total revenue with brand in one test and lower acquisition cost without it across the reported experiments. For new customers, advertisers using New Customer Value Mode saw a 7% lower new-customer acquisition cost in Google's tests. Then reconcile attributed sales with the store's order and profit data.
4. Set a realistic bid target and test it. Google explains that target ROAS bidding aims for conversion value per cost across the campaign, not an exact return on each order. Begin near what the campaign has actually delivered, since the median target advertisers set rose from 4.7x to 6.0x (stat 15), and achieved ROAS is a separate measure. Then adjust in steps while tracking volume and profit.
5. Review incrementality. When scale permits, run a Shopping-to-PMax experiment or another holdout. Check whether the change grew total sales or only shifted credit between campaigns. Stats above show how often PMax and Search compete for the same queries, and how far platform-reported results can differ from a holdout. Allow for conversion delay before judging the result.
What Is a Good Performance Max ROAS in 2026? The Bottom Line
A good Performance Max ROAS in 2026 is not a single number. The PMax-only samples here put the median at 2.30x and the average at 4.37x, the six Google Ads category medians shown range from 2.06x to 4.35x, and brand traffic, Search overlap and seasonality can each move the same account's reported return.
The constant is your starting point: the break-even ROAS set by your contribution margin, plus the profit buffer you need.
Use these benchmarks as context.
Set a bid target near what your campaign actually delivers, separate brand from non-brand demand, and confirm with an experiment or holdout that PMax is growing total sales.
A good target is one your margins can support while acquiring the customers you meant to reach.
If you want a second pair of eyes on your numbers, explore 9AM's media buying services to set a PMax target around your product margins, campaign mix, and acquisition goals.
FAQ
What is a good PMax ROAS for my ecommerce category?
Compare a PMax-only study with your campaign's own purchase value and margin first. The PMax samples here report 2.30x median and 4.37x average ROAS in different account groups; the six category figures are for all Google Ads. A break-even ROAS of 1 ÷ contribution margin is a useful starting calculation before aiming above break-even.
Are the category ROAS and CPA figures PMax-only?
No. The six-row category table and the $28.14 CPA are for Google Ads overall. PMax-specific studies are identified in their individual stats.
Should I include branded traffic in a PMax benchmark?
State whether it is included. The 11-account brand analysis found at least a quarter of PMax conversion value from brand searches in five accounts. Compare like-for-like brand treatment before using an external ROAS target.
Is PMax ROAS lower than Standard Shopping?
It depends on the sample and period. The paired observations above range from equal medians in one account snapshot to a 1% PMax deficit in Tinuiti's Q4 retailer group and a small PMax advantage in Optmyzr's December dual-format group.
Sources and Measurement Notes
The article uses original account datasets, Google platform findings, and 9AM's own published service figures. Studies cover different countries, conversion actions, attribution settings, and dates. Median, mean, target ROAS, and purchase-only CPA have their stated meanings. A source is linked at its first substantive appearance; later references identify the earlier stat. The category table is Google Ads-wide; its rows should not be labeled as PMax-only benchmarks.