


Paid media teams report ROAS. Finance teams judge profit. The gap between those two numbers is where most budget arguments start, and it's where good-looking campaigns quietly lose money.
Common Thread Collective illustrates the problem with a worked example in which a 4x ROAS brand loses $30,000 while a 2.5x ROAS brand earns $47,500. The difference is everything ROAS leaves out: product costs, shipping, fees, returns, and discounts.
This guide shows how to calculate contribution margin per order, turn it into breakeven and target ROAS, feed it into Google and Meta bidding, and check whether the next budget increase actually adds profit.
P.S. If you'd like help building the margin model, our analytics and measurement team connects ad spend to contribution margin for ecommerce brands.
TL;DR
- Contribution margin is net revenue minus variable costs. For paid media, the number that matters is CM2: what's left per order after product, fees, fulfillment, shipping, and returns, before ads.
- Breakeven ROAS equals 1 divided by your CM2 percentage. A 42% CM2 means you break even at about 2.4x.
- Target ROAS equals 1 divided by CM2% minus the CM3% you want to keep.
- Google and Meta can both bid on margin-weighted values, but only if you send them.
- Judge budget increases on marginal contribution. A blended ROAS above breakeven can still be losing money on the last dollar spent.
Before we begin, here’s our view: we treat media buying as the lab and measurement as the loop that decides what earns the next dollar. That only works if the lab knows what a win is worth, and revenue can't tell it. Contribution margin can. We judge accounts on CAC and MER over platform ROAS, and we count spend that adds revenue without adding contribution as waste, however good the dashboard looks.
What Is Contribution Margin in Marketing?
Contribution margin is net revenue minus variable costs. The standard contribution margin formula, as the Corporate Finance Institute puts it, is net sales revenue minus variable costs. In marketing, it's the money each order leaves to pay for advertising and fixed costs.
Ecommerce teams usually split it into layers, so each level answers a different question. Polar Analytics describes the CM1, CM2, and CM3 ladder that most DTC tools now use:
| Level | Formula | What it answers for paid media |
|---|---|---|
| CM1 | Net revenue minus cost of goods sold | Is the product priced well enough to advertise at all? |
| CM2 | CM1 minus payment fees, fulfillment, packaging, shipping, and returns | How much can we afford to pay for each order? |
| CM3 | CM2 minus ad spend | Did the campaign add profit after paying for itself? |
Conventions differ across tools.
Some put marketing inside CM2, and a few add a CM4 for other variable costs. This article uses CM2 for contribution margin before ads and CM3 for contribution margin after ads. Whatever labels you use, agree them with finance once and keep them fixed.
Contribution Margin vs Gross Margin for Ad Decisions
Gross margin subtracts only the cost of goods sold from net revenue. Contribution margin also deducts variable costs outside COGS, such as payment processing fees and outbound shipping. That makes it a better starting point for deciding how much you can spend to acquire an order.
| Cost | In gross margin | In contribution margin (CM2) |
|---|---|---|
| Cost of goods sold | Yes | Yes |
| Discounts and refunds | Usually (via net revenue) | Yes |
| Payment processing fees | No | Yes |
| Pick, pack, and packaging | No | Yes |
| Outbound shipping | No | Yes |
| Returns and reverse logistics | No | Yes |
| Ad spend | No | No (that's CM3) |
A brand with a healthy gross margin can still have a thin CM2 once shipping and returns land. That's why the rule is simple: never set a ROAS target from gross margin. It sets the bar too low and approves spend that loses money on every order.
How to Calculate Contribution Margin for Paid Media, Step by Step
Calculate contribution margin per order, starting from net revenue and subtracting each variable cost in turn. Six steps get you from the order total to CM3:
- Start from net revenue. Take the order value and subtract discounts and expected refunds. A $100 order with a 10% code is $90 of net revenue.
- Subtract cost of goods sold to get CM1. Use landed cost: the product, inbound freight, and duties.
- Subtract payment processing fees. Transaction fees are small per order but never zero. Stripe charges 2.9% + 30¢ per domestic card transaction, and Shopify Payments ranges from 2.9% + 30¢ on Basic to 2.25% + 30¢ on Plus.
- Subtract fulfillment, packaging, and shipping. Use what you actually pay per order, and update it when carriers reprice. FedEx's next US list-rate increase is 5.9% on average, effective January 2027.
- Subtract a returns reserve to get CM2. Returns are a cost of the order, even when they happen weeks later. The NRF estimates that 15.8% of 2025 retail sales were returned, with an online return rate of 19.3%, and that 9% of returns were fraudulent.
- Subtract ad spend to get CM3. Use ad cost per order at the ROAS you're planning for.
Here's a worked example for a single order, using illustrative numbers:
| Line | Amount | Running total | % of net revenue |
|---|---|---|---|
| Gross order value | $100.00 | ||
| Discount (10%) | −$10.00 | $90.00 net revenue | 100% |
| Cost of goods sold | −$32.00 | $58.00 = CM1 | 64% |
| Payment fees (2.9% + 30¢) | −$2.91 | $55.09 | |
| Pick, pack, packaging | −$4.00 | $51.09 | |
| Outbound shipping | −$8.00 | $43.09 | |
| Returns reserve (12% return rate × ~$42 lost per return) | −$5.00 | $38.09 = CM2 | 42% |
| Ad spend at 3x ROAS | −$30.00 | $8.09 = CM3 | 9% |
Marketing-adjacent costs are where most models go wrong. Here's how we classify them:
| Cost | Treatment | Why |
|---|---|---|
| Agency retainer | Fixed (below CM3) | It doesn't change with each order |
| Agency fee as a % of spend | Variable, with ad spend (CM3) | It scales with media |
| Creative production | Marketing cost for the period (CM3) | It's spent to drive the same orders |
| Creator and influencer fees | Marketing cost (CM3) | Paid to acquire customers |
| Affiliate commissions | Variable per order (CM2 or CM3, applied consistently) | Paid only when an order happens |
| Software and analytics tools | Fixed (below CM3) | Flat monthly cost |
Insider tip: build the model per order first, then per month. A per-order sheet is easier for finance to audit, and it makes the effect of a discount or a carrier price change obvious in one line. It's also the sheet our media buying team sets bid targets from on every account we run.
How to Turn Contribution Margin Into Breakeven and Target ROAS
Breakeven ROAS equals 1 divided by your CM2 as a percentage of net revenue, also called the contribution margin ratio. In the example above, CM2 is 42%, so breakeven ROAS is 1 ÷ 0.423, or about 2.36x. Below that, every order loses money once ads are paid.
| CM2 (% of net revenue) | Breakeven ROAS |
|---|---|
| 20% | 5.00x |
| 25% | 4.00x |
| 30% | 3.33x |
| 35% | 2.86x |
| 40% | 2.50x |
| 45% | 2.22x |
| 50% | 2.00x |
| 60% | 1.67x |
Breakeven is the floor. To keep profit, set a target ROAS from the CM3 you want:
- Target ROAS = 1 ÷ (CM2% − target CM3%). With a 42% CM2 and a 15% CM3 goal, that's 1 ÷ 0.27, or about 3.7x.
- Maximum CPA = CM2 per order − profit buffer. With $38 of CM2 and a $10 buffer, you can pay up to about $28 per order.
Use the same math to set a blended target for the whole account. Our guide to marketing efficiency ratio (MER) covers how to track that target across channels, so platform-reported ROAS can't drift away from it.
How to Feed Contribution Margin Into Google and Meta Bidding
Both Google and Meta can bid toward profit, but only on the values you send them. But when value-based bidding uses purchase revenue, a $90 order with a 20% contribution margin has the same reported value as a $90 order with a 60% margin. To distinguish their economic value, send contribution-margin values and use a bidding setup that optimizes for those values.
On Google:
- Gross profit reporting. When you add cost of goods sold in Merchant Center and send conversions with cart data, Google Ads can report gross profit for your purchases.
- Profit as the bidding value. Google's value-based bidding guidance lists profit as a value you can bid toward, so a margin-weighted conversion value becomes the target.
- Conversion value rules. Value rules adjust conversion values by audience, location, or device, which helps when margin differs by segment.
- Gross Profit Optimization. Google began rolling out a campaign setting that optimizes to profit in late 2024, to select accounts, using the same cart data and COGS inputs.
On Meta:
- Value rules. Meta's value rules, rolled out in July 2025, let you raise or lower bids for up to 10 segments, with the first matching rule applied.
- Profit-based ROAS. Meta has been testing ROAS optimization based on profit margin, with margin data sent through the Conversions API.
| Platform | Feature | What you send | Status |
|---|---|---|---|
| Gross profit reporting | COGS in Merchant Center plus cart data | Available | |
| Value-based bidding on profit | Margin-weighted conversion values | Available | |
| Gross Profit Optimization setting | Cart data plus COGS | Select accounts | |
| Meta | Value rules | Segment-level bid adjustments | Available |
| Meta | Profit-based ROAS | Margin data via Conversions API | Testing |
The practical step is the same on both platforms: send a margin-weighted conversion value, ideally CM2 per order, from your server. That depends on reliable server-side tracking, since browser pixels miss too many orders to train on margin.
Marginal Contribution: Why Average Margins Mislead When You Scale
Marginal contribution is the contribution added by the next dollar of spend, and it's the number that should approve a budget increase. Average CM3 and blended ROAS describe the whole account. They hide what the last few thousand dollars bought.
Here's an example using the same 42% CM2 and 2.36x breakeven:
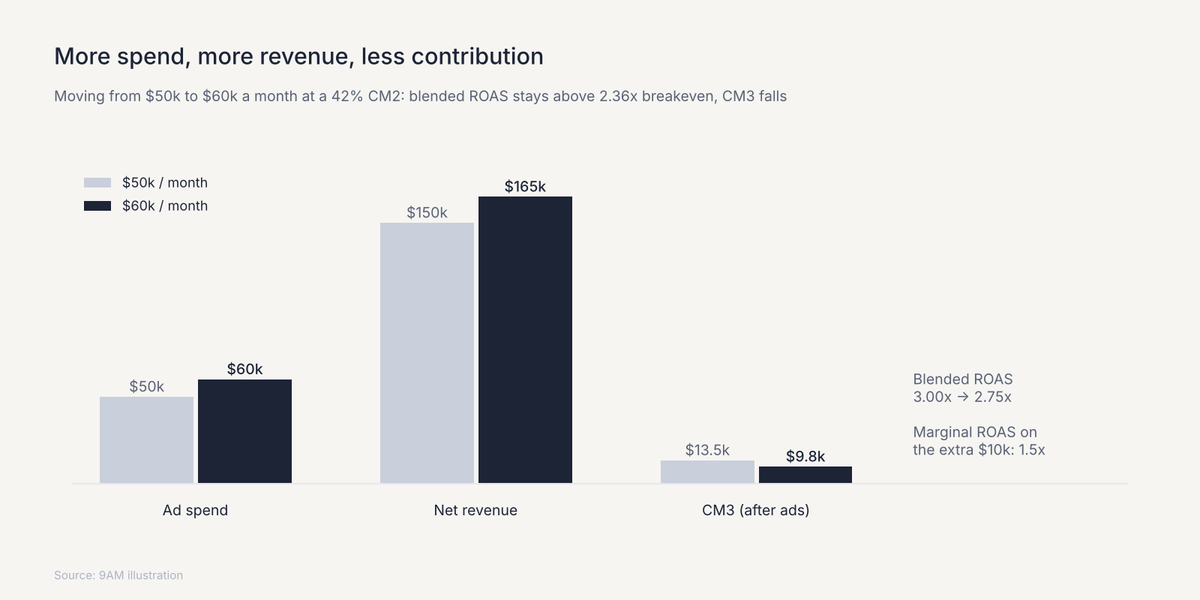
- At $50,000 of monthly spend, the account drives $150,000 of net revenue. CM3 is about $13,500.
- The team raises spend to $60,000, and revenue rises to $165,000. Blended ROAS is 2.75x, comfortably above breakeven.
- The extra $10,000 of spend brought $15,000 of revenue, a marginal ROAS of 1.5x. At 42% CM2, that's about $6,300 of contribution against $10,000 of spend.
- CM3 falls to about $9,800. The account is spending more and making $3,700 less, which is exactly the kind of scenario a paid media revenue forecast should flag before the budget moves.
Platform attribution makes this harder to see. In Haus's analysis of 640 Meta incrementality experiments, Advantage+ campaigns over-reported results by about 12 percentage points compared with manual campaigns. That gap is wide enough to make a losing budget step look profitable. Marginal decisions need incremental revenue, which means testing.
Before each budget step, run this check:
- Record the current CM3 for the account and for the channel you plan to scale.
- Raise spend in one step and hold everything else steady for long enough to read it.
- Measure incremental revenue with a holdout or a geo-lift test. Do not follow platform ROAS because it reports attributed revenue, including purchases that may have happened without the ads. It cannot tell you how much additional revenue the budget increase caused.
- Multiply incremental revenue by CM2% and subtract the extra spend. Keep the step only if the result is positive.
Contribution Margin by Channel, Campaign, and Offer
Contribution margin should be calculated at the level where you make decisions, because channels, offers, and customer types carry different costs.
Channel-Level Contribution Margin
Channel-level CM uses the same per-order costs but the channel's own product mix, discounts, and ad spend. A channel that sells mostly low-margin bundles needs a higher ROAS target than one that sells full-price hero products, even at the same AOV.
Offer-Level Contribution Margin
Every discount, bundle, or free-shipping threshold changes CM2, so each offer has its own breakeven ROAS.
A 20% discount on the example order cuts net revenue to $80 while most costs stay the same. Payment fees dip to about $2.62, so CM2 falls to about $28.38, or 35% of net revenue, and breakeven ROAS rises from 2.36x to about 2.82x by about 20%.
To preserve the original $8.09 of CM3 per order, the discounted offer needs about 3.94x ROAS, roughly 31% above the original 3x.
Calculate breakeven per offer before launching it in ads, and give each promotion its own ROAS target for the length of the campaign.
First-Order vs Repeat Contribution Margin
First orders carry the full acquisition cost. Repeat orders often carry little or none. Brands with strong repeat rates can accept a lower first-order CM3, even a negative one, because the second and third orders arrive with most of their CM2 intact. The condition is that the cash comes back on time, which is what CAC payback modeling for DTC measures.
Contribution Margin Mistakes in Paid Media Reporting
Most contribution margin mistakes come from leaving a cost out or counting revenue twice. This diagnostic table covers the ones we see most often:
| What you see | Likely cause | What to check |
|---|---|---|
| ROAS above target, but finance reports a loss | Target set from gross margin | Rebuild the target from CM2 |
| CM2 looks stable, but cash is tight | Returns reserve too low or lagging | Compare the reserve with actual returns by cohort |
| Every channel shows positive CM3, but the total is negative | Platforms double-count the same orders | Reconcile channel revenue with store revenue |
| CM3 falls after a promo, despite higher ROAS | Discount not reflected in net revenue | Calculate breakeven per offer |
| Breakeven ROAS hasn't changed in a year | Stale cost inputs | Update fees, shipping, and COGS quarterly |
When channels claim more revenue than the store recorded, an attribution model audit is the place to start.
Make Paid Media Decisions on Contribution Margin with 9AM
Contribution margin turns ROAS into a decision you can defend to finance. CM2 sets the breakeven and target ROAS, CM3 shows what each campaign kept, and marginal contribution decides whether the next budget step pays. Fixed costs still come after CM3, so CM3 isn't net profit, but it's the right number for media decisions.
That's how we run paid media at 9AM.
Media buying, creative, and measurement sit in one team, so margin inputs flow into bid targets and budget steps without waiting for a monthly finance review.
If you'd like us to build or check your model, book a strategy call. We'll map your per-order costs, set breakeven and target ROAS by channel, and show where your last budget increase added or lost contribution.
FAQs
Should agency fees count against CM3?
A fee that scales with ad spend should, because it rises with every dollar of media. A flat retainer belongs with operating expenses below CM3. Treat them consistently month to month, so CM3 trends stay comparable.
What is a good CM3 for a DTC brand?
A contribution margin after marketing (CM3) of 20-35% of net sales is healthy for most DTC brands, according to Common Thread Collective's ranges, with below 15% as a danger zone. Those ranges come without a published sample, so your own CM3 trend over six months is the better benchmark, and the basis for the blended target in our guide to choosing a north star metric.
How often should contribution margin inputs be updated?
Review costs quarterly, and immediately after any price, carrier, or payment change. Update the returns reserve monthly against actual returns, since it moves with season and product mix.
How should subscription brands treat first-order contribution margin?
Model first-order CM3 and repeat-order CM3 separately. A negative first-order CM3 can be fine if retention pays it back within your payback target, but set that limit in advance and check every cohort against it.