


Most teams fix the funnel step that looks worst in the report. That instinct feels logical, but it usually sends the next quarter's work to the step with the least to give.
The pressure to pick well is rising.
Contentsquare's 2026 benchmark found global conversion rates fell 5% in 2025, which means fewer conversions to spread each fix across.
Every week spent on the wrong step is a week the right one keeps leaking.
This guide solves that. We walk you through a funnel leak analysis from start to finish: mapping the steps, confirming each leak is real, putting a dollar value on it, finding the cause, and ranking fixes by what they're worth per week of work.
P.S. If you'd rather run this with a team that does it every quarter, our growth strategy team builds the fix roadmap with you.
TL;DR
- Map the funnel as a closed sequence of steps, with one event marking each step.
- Confirm a leak isn't a tracking error before you put any value on it.
- Value each step by its realistic headroom, because the biggest drop-off is rarely the biggest opportunity.
- Find the cause with recordings, surveys, and usability tests before you design the fix.
- Rank fixes by value per week of effort, weighted by confidence, and judge each one on orders and CAC.
Our view: a funnel report tells you where people leave, and nothing about which fix pays. We treat every leak as a hypothesis with a price on it: the orders a realistic fix would add, the weeks it would take, and how sure we are about the cause. That framing turns a dashboard of red numbers into a short, ranked list. It also keeps the team honest, because a fix only counts when orders and blended CAC move.
What Is a Funnel Leak Analysis?
Funnel analysis measures how many users move from one step of a conversion path to the next. A funnel leak analysis goes one step further: it ranks each drop-off by the revenue a realistic fix would recover.
The difference matters because not all drop-off is a leak.
Some visitors were never going to buy. They were researching, comparing prices, or browsing on a lunch break. A leak is drop-off above what a step should lose, given the traffic arriving at it. The analysis exists to separate the two and put a number on the part you can win back.
How to Map Your Conversion Funnel Steps
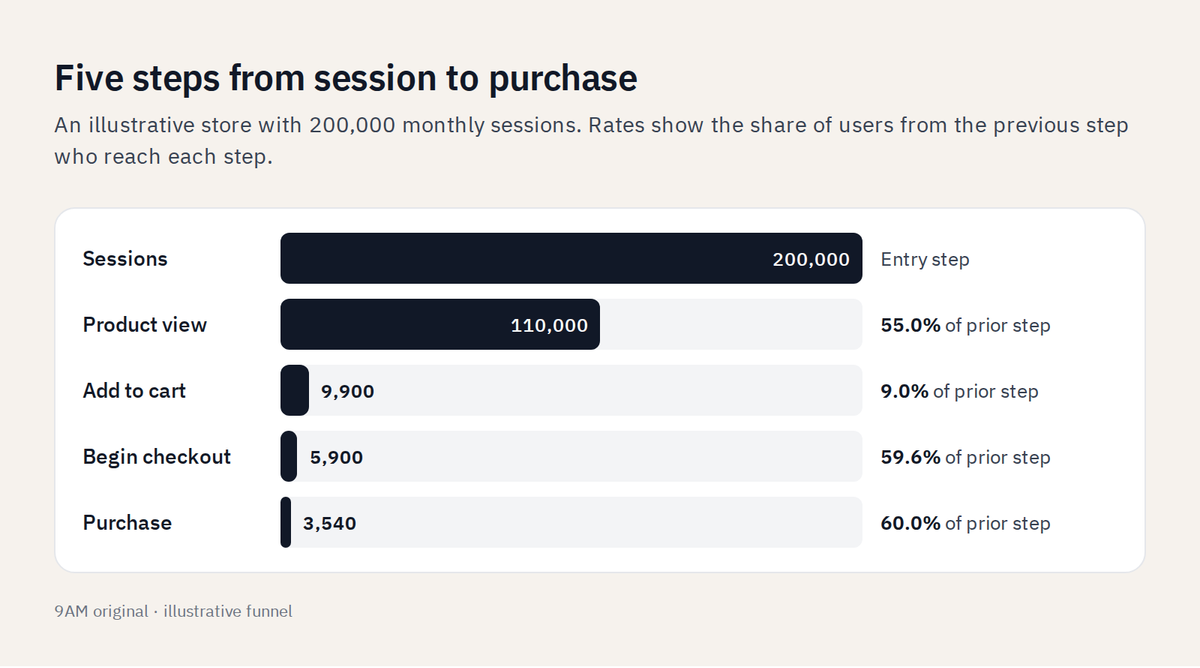
Map the funnel as a short, fixed sequence of steps, each tied to one event your analytics already records. Five to six steps is enough for most businesses.
Ecommerce Funnel Steps
A standard ecommerce funnel runs from session start to product view, add-to-cart, begin checkout, and purchase. In GA4, those map to the session_start, view_item, add_to_cart, begin_checkout, and purchase events. If your checkout has several pages, add shipping and payment as separate steps so you can see which page loses people.
Lead Generation Funnel Steps
A lead generation funnel runs from landing page view to form start, form submit, qualified lead, and opportunity. The first three live in your analytics tool. The last two live in your CRM, so join the data on a lead ID or email hash. Without the CRM steps, you'll optimize for form fills that sales never accepts.
Open and Closed Funnels
GA4 offers two funnel types.
- An open funnel counts users who enter at any step.
- A closed funnel counts only users who enter at the first step.
Pro tip: Use a closed funnel for leak analysis. It keeps every step rate describing the same group of people, so a jump in the rate means users moved forward and not that a new group joined midway.
How to Measure Drop-Off at Each Funnel Step
Measure each step as a rate, then split that rate by the segments most likely to hide a leak.
Step Conversion Rate and Abandonment Rate
The step conversion rate is the number of users who reach the next step divided by the users at the current step. The abandonment rate is the inverse. GA4 uses a simple example: if 200 users start a session and 140 view a product, 60 users, or 30%, abandoned at that step.
Track both numbers for every step, over the same date range. A single overall conversion rate can stay flat while one step gets worse and another gets better, which hides the real movement.
Segment Drop-Off by Device, Traffic Source, and Visitor Type
Blended rates hide leaks. A checkout step can look fine overall and lose twice as many mobile users as desktop users.
Split every step by device, traffic source, and new and returning visitors.
Returning visitors usually convert better: Contentsquare's 2026 data puts repeat-visitor conversion at 2.9%, ahead of first-time visitors. A step that loses returning visitors at the same rate as new ones is a strong signal that something on the page is broken.
Judge each traffic source against its own baseline. Paid social and paid search arrive with different intent, so compare them with landing page conversion benchmarks by traffic source and not with one site-wide target.
How to Confirm a Funnel Leak Is Real
Before you put a value on a leak, rule out measurement. A surprising share of "leaks" are tracking problems that look like user behavior.
Check these in order:
- Events that fire late or twice. A purchase event that fires on page reload doubles some orders and hides others.
- Payment redirects that break the session. Third-party payment pages often start a new session, so purchases look like they came from nowhere.
- Consent gaps. Users who decline cookies may vanish partway through the funnel.
- Bot and internal traffic. Bots inflate the top of the funnel and make early steps look leakier than they are.
- Promotions and seasonality. A sale week changes who arrives and how they behave.
One fast test: if a step looks far worse on a single browser or device, suspect a bug or a tag issue before a design problem. Then reconcile analytics purchases with backend orders for the same week. A gap above a few percent means the measurement needs fixing first, and server-side tracking closes most of the gaps browser-only tags leave open.
How to Calculate the Value of Each Funnel Leak
Value each leak by the orders a realistic fix would add, not by how many people the step loses.
Assess Drop-Off Size and Recoverable Revenue
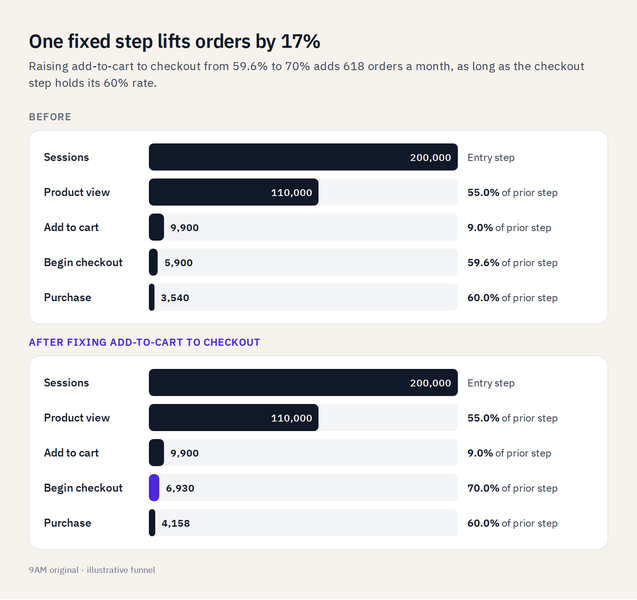
Funnel steps multiply. Orders equal sessions times every step rate in sequence, so a 10% relative lift at any step raises orders by the same 10%. A 10% lift on a 9% add-to-cart rate and a 10% lift on a 60% checkout rate add exactly the same number of orders.
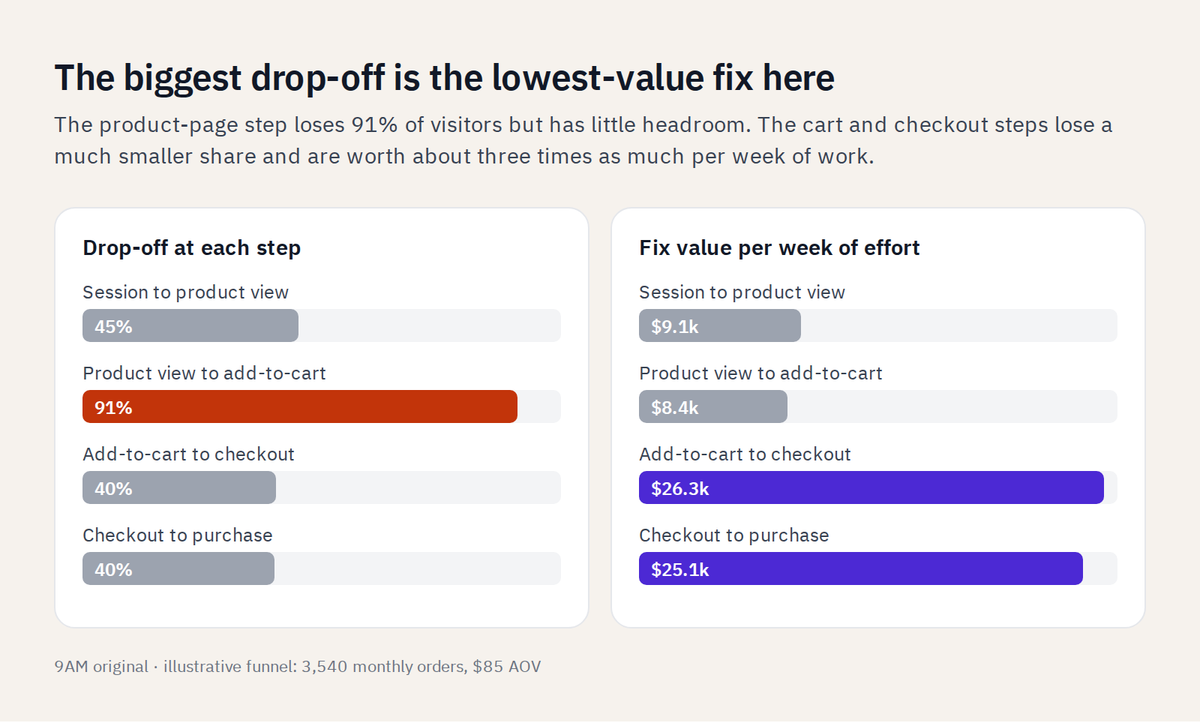
That's why drop-off size alone tells you nothing about value. A step that loses 91% of visitors can be the least valuable fix in the funnel, because it may have very little room to improve. What matters is headroom: how far the step's rate can realistically rise.
Set a Realistic Target Rate for Each Step
Set each step's target from evidence, in this order: your own best segment, your own best recent period, then an external benchmark.
Your best segment is usually the most honest target. If desktop users complete checkout at 75% and mobile users at 52%, the mobile rate has proven headroom on your own site. External research helps for steps you can't compare internally.
Baymard's checkout research finds the average large ecommerce site could gain about 35% in conversion rate just from checkout design changes, which makes checkout a common source of headroom.
Convert Step Headroom Into Orders and Revenue
Headroom converts directly into orders. Divide the target rate by the current rate and subtract one, then multiply by your current orders.
The table uses an illustrative store: 200,000 sessions a month, 3,540 orders, and an $85 average order value.
| Step | Current rate | Target rate | Headroom | Added orders | Added revenue |
|---|---|---|---|---|---|
| Session to product view | 55.0% | 60.0% | 9.1% | 322 | $27,400 |
| Product view to add-to-cart | 9.0% | 10.0% | 11.1% | 393 | $33,400 |
| Add-to-cart to checkout | 59.6% | 70.0% | 17.4% | 618 | $52,500 |
| Checkout to purchase | 60.0% | 75.0% | 25.0% | 885 | $75,200 |
Revenue overstates the win, because every order carries product, shipping, and payment costs. Convert added revenue into contribution margin for paid media before comparing fixes, especially if some steps attract discount-driven orders.
How to Find the Cause of a Funnel Leak
Find the cause before you design the fix. The value calculation tells you where to look; the diagnosis tells you what to change.
Quantitative Signals in Analytics
Start with the data you already have. Look at error events, time spent on the step, field-level drop-off in forms, and the device and browser splits from the measurement stage. A form that loses most users at the phone number field, or a checkout page with long load times on Android, points straight at the cause.
Session Recordings and Frustration Signals
Recordings show what the numbers can't. Filter them to sessions that reached the leaking step and left. Look for frustration signals: Microsoft Clarity defines rage clicks as repeated clicks in one area in quick succession, and dead clicks as clicks that get no response.
Both tend to point to broken buttons, slow requests, or elements that look clickable and aren't. These signals are common. Contentsquare's 2026 Digital Experience Benchmarks for Product Leaders puts the share of sessions with frustration at about 35% to 37%, depending on how often teams monitor them.
On-Site Surveys and Usability Testing
When recordings show where people stop but not why, ask them. A one-question exit survey on the leaking step ("What stopped you from completing your order today?") usually names the cause in a week. Google's own GA4 guidance says to run usability tests when the reasons for abandonment aren't obvious.
Five sessions with real customers usually surface the main issue.
Common Funnel Leaks by Step
Most leaks fall into a familiar set of causes. Use this table as a starting list of hypotheses, then confirm with the methods above.
| Step | Typical leak | First check |
|---|---|---|
| Landing page | Page doesn't match the ad's promise | Compare ad headline with page headline |
| Product page | Price, shipping, or delivery time is hard to find | Recordings of users scrolling and leaving |
| Cart | Surprise costs appear at cart | Exit survey on the cart page |
| Checkout | Forced account creation or strict password rules | Field-level drop-off on the login step |
| Lead form | Too many fields, or a phone field asked too early | Field-level drop-off in the form |
The landing-page leak is the most common one in paid traffic, and landing page alignment covers how to fix message match. Checkout leaks are often smaller choices with large effects: Baymard observed strict password rules causing up to 19% checkout abandonment among returning users who struggled to sign in.
How to Prioritize Funnel Fixes by Value and Effort
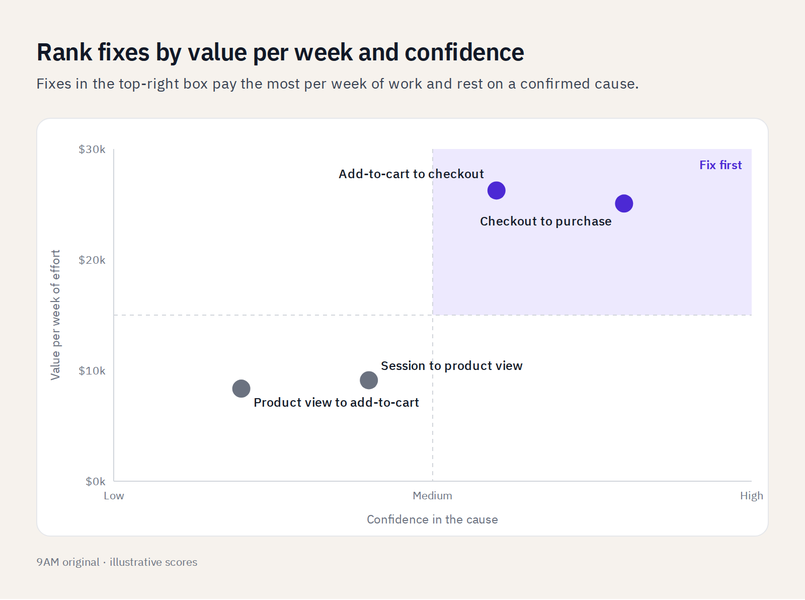
Rank fixes by value per week of effort, then weight that value by how confident you are about the cause.
Score every candidate fix on three things.
- Revenue headroom comes from the value calculation.
- Effort is the number of weeks the fix will take to design, build, and test.
- Confidence reflects the evidence behind the cause: a cause confirmed by recordings and a survey earns a higher score than one the team only suspects.
Run the example funnel through that scoring.
- Add-to-cart to checkout is worth about $52,500 a month and takes two weeks, or about $26,300 per week of effort.
- Checkout to purchase is worth more in total, about $75,200, but takes three weeks, or about $25,100 per week.
- Product view to add-to-cart, the step with the 91% drop-off, comes last at about $8,400 per week of effort.
Weight those by confidence, and the confirmed checkout fix moves to the top, with the cart fix close behind.
Keep the ranked list as a live backlog, review it in a weekly marketing cadence, and re-score it whenever a test result or new recording changes the evidence.
How to Test and Measure a Funnel Fix
Test each fix against a control, decide on orders and CAC, and check the steps after the one you changed.
Run an A/B test where traffic allows, splitting users between the current step and the fixed one. Where traffic is too thin, use a before-and-after comparison with a holdout period, and treat the result as directional.
Either way, set the sample size and the stop date before launch, so the result isn't called on an early swing.
Judge the fix on orders and blended CAC.
A fix can push more users to the next step only for them to leave there. A shorter checkout form, for example, can raise checkout starts while payment failures rise at the next step. Check every downstream step before you call a winner.
Keep a short test log for every fix: the step, the hypothesis, the target rate, the result, and the downstream effect.
After a few quarters, the log shows which kinds of fixes tend to pay on your site, and the confidence scores in your backlog get sharper with each entry. It also stops the team from re-running a test that already failed.
This is how a testing program compounds.
The method only pays if someone owns it. Leak analysis is easy to start and easy to abandon after the first round of fixes ships. That means one person who keeps the ranked backlog, a fixed review day, and measurement the team trusts, so a test result settles the question.
Most teams have the data to run a leak analysis; fewer have the tracking reconciled well enough to believe the answer. When the numbers disagree, every result turns into a debate. Our analytics team sets up the funnel tracking, the backend reconciliation, and the test design behind each fix.
Find Your Highest-Value Conversion Fix with 9AM
A funnel leak analysis turns a report full of drop-offs into a short, ranked list of fixes. Map the steps, confirm the leaks are real, value each by its headroom, find the cause, and rank by value per week of effort.
9AM runs that analysis with brands as part of our growth roadmap. Our analysts reconcile the funnel data, our strategists rank the fixes, and our media team makes sure the traffic arriving at each step is the traffic the fix was built for.
Book a strategy call and we'll walk through your funnel and the leaks worth fixing first.
FAQs
How often should you run a funnel leak analysis?
Run a full analysis every quarter, and a quick check after any site release or major shift in traffic mix. Between full runs, watch step rates weekly so a new leak shows up within days.
What is a good drop-off rate for each funnel step?
There's no single good rate, because each step's rate depends on device, traffic source, and product price. Compare each step against your own best segment first, then against external benchmarks for that step type.
Should you fix the top of the funnel or the bottom first?
Neither by default. Because steps multiply, the same relative lift adds the same orders anywhere in the funnel. Fix the step with the most headroom per week of effort, wherever it sits.
Can paid media changes create funnel leaks?
Yes. New audiences, placements, or creative angles change who arrives at the site, so step rates can drop with no change to the pages themselves. Check traffic-mix shifts before you redesign a step that suddenly looks worse.