

The average landing page converts at 5.89% to 6.6% across all traffic, but the rate changes sharply by source: about 2.1% to 2.6% for organic search, 2.8% for paid search, and 0.61% for paid social in site analytics.
This guide collects published benchmarks from named datasets, groups them by traffic source, and states the sample, period, and definition behind each figure, so you can pick the comparison that fits your page.
If you want help turning these numbers into a testing plan, the 9AM Growth Strategy team covers landing page optimization and CRO consulting.
Key Takeaways: What Landing Page Conversion Rates Look Like in 2026
Paid search converts about four times as often as paid social, automated email flows produce 13 times the order rate of campaigns, and AI referral traffic now converts above other sources in US retail. These five findings summarize the data below.
- Across all traffic, published landing page benchmarks sit at 5.89% (HubSpot average) and 6.6% (Unbounce median). Ad platforms report higher numbers, such as 8.18% for search ads and 8.54% for Meta lead ads, because they count conversions per click and, for lead ads, inside the platform.
- Paid search converted about four times as often as paid social in Contentsquare's analysis of 3,590 websites.
- Automated email flows produce placed order rates 13 times higher than one-off campaigns in Klaviyo's 2026 data.
- AI referral traffic moved from converting below other sources to converting above them in US retail within about a year, according to Adobe. Contentsquare's cross-industry figure for AI referrals is still a modest 1.3%.
- Page speed and device mix change results inside every channel, so they belong in any benchmark comparison.
Landing Page Conversion Benchmarks by Traffic Source at a Glance
This table compares conversion benchmarks for organic search, paid search, paid social, TikTok, email, and AI referrals. Figures come from different datasets and definitions, so use them as ranges.
| Traffic source | Benchmark | Dataset |
|---|---|---|
| All sources | 6.6% median, 5.89% average | Unbounce 2024 report, HubSpot |
| Organic search | 2.1% (B2C purchases), 2.6% (B2B marketing qualified leads) | First Page Sage, 2023 data |
| Paid search | 8.18% in ad platforms, 2.8% in site analytics | WordStream and LocaliQ 2026, Contentsquare 2026 |
| Paid social | 0.61% in site analytics, 8.54% for Meta lead ads | Contentsquare 2024, WordStream 2026 |
| TikTok ads | 1.56% | Triple Whale, 2026 |
| Flows convert at 13 times the order rate of campaigns | Klaviyo, 2026 | |
| AI referrals | 1.3% cross-industry, 60% higher than non-AI in US retail | Contentsquare 2026, Adobe July 2026 |
How Do You Read Landing Page Conversion Benchmarks?
Check three things before comparing your rate to a benchmark: what the dataset counts as a conversion, whether the figure is a median or a mean, and whether it is measured per click in an ad platform or per session in analytics. Mixing these gives misleading comparisons.
- Each business decides what counts as a conversion. An ecommerce conversion rate counts orders per session, while an overall conversion rate also includes actions such as newsletter sign-ups. Analytics tools also disagree on what counts as a session and how credit is assigned, so use one tool as the source of truth for your own trend (Shopify ecommerce conversion rate guide).
- Check whether a figure is a median or a mean. Medians describe a typical page better because a few pages with extreme rates pull averages up. WordStream's published "averages", for example, are medians, as noted in its Google Ads and Meta sections below.
- Check the denominator before comparing conversion rates. An ad report may calculate conversions relative to clicks or other eligible interactions, while a website report may use sessions or visitors. Email order rates use a different reporting basis again. Match both the conversion action and the denominator before comparing your results with a published benchmark.
What Is a Good Landing Page Conversion Rate Across All Traffic?
A good landing page conversion rate is one that beats the median of comparable pages with the same offer and the same traffic source. Cross-industry baselines are a starting point. The datasets below show where the typical page sits and where the top performers begin.
- The median landing page conversion rate is 6.6% across all industries, based on 41,000 landing pages, more than 57 million conversions, and 464 million visitors (Unbounce Conversion Benchmark Report, 2024).
- HubSpot cites an average conversion rate of 5.89% across industries and treats 10% as the benchmark for a good rate. Landing pages are the least used sign-up form but have the highest conversion rate among sign-up forms, at 23% (HubSpot landing page statistics).
- Contentsquare's 2026 benchmark covers 99 billion sessions across more than 6,000 sites. Search had the highest conversion rate of the paid channels at 2.8%. Returning visitors converted at 2.9% against 1.7% for new visitors. Desktop conversion was 74% higher than mobile, even though mobile made up 69.9% of traffic. In finance, paid traffic converted at 1.83% against 2.66% for organic (Contentsquare 2026 Digital Experience Benchmarks).
- Ecommerce conversion is lower than lead generation. Statista reports that 1.4% of global ecommerce visits converted into purchases in Q1 2026 (Statista global online shopper conversion rate).
- Shopify’s August 2026 ecommerce conversion guide cites a global average of 2.66% from Dynamic Yield, whose benchmark covers more than 400 brands. The guide also reproduces June 2026 industry rates: 4.58% for food and beverage, 5.32% for beauty and personal care, 5.7% for pet care and veterinary services, 2.77% for fashion, 1.76% for consumer goods, 1.29% for home and furniture, and 0.63% for luxury and jewelry. These are dated figures; Dynamic Yield’s live dashboard updates over time (Shopify ecommerce conversion guide cited above).
Converting below your vertical's benchmark? See how 9AM helps ecommerce brands close the gap between traffic and revenue.
If you’re more of a visual learner, watch this clip on optimizing your product pages for more sales.
Organic Search Conversion Rate for Landing Pages
Organic search usually converts lower than paid channels because many visitors are still researching. Rates also depend on whether a conversion means a purchase or a qualified lead. These figures separate B2C from B2B and show how strict lead definitions change the result.
- In a meta-analysis of data from January to September 2023, organic search converted at 2.1% for B2C companies (a conversion meant a purchase) and 2.6% for B2B companies (a conversion meant a marketing qualified lead). Organic social converted at 2.4% for B2C and 1.7% for B2B (First Page Sage website conversion rates).
- Across more than 80 clients with SEO campaigns running for at least six months between 2021 and 2025, landing page conversion rates were 1.1% for B2B SaaS, 1.1% for software development, 1.8% for biotech, 1.7% for business consulting, and 1.0% for aviation (First Page Sage landing page conversion rates by industry). The study counts actions that produce marketing qualified leads, such as contact form submissions, appointment bookings, and demo requests. Although the sample consists of clients with SEO campaigns, the published methodology does not specify that the reported rates exclude visitors from other traffic sources.
Organic conversion rates are low for B2B and SaaS. See 9AM's approach to tech and SaaS growth.
Paid Search Conversion Rate for Landing Pages
Paid search reaches people who are already looking for a solution, so it is the strongest paid channel for conversions. Its rate looks different in ad platforms and in site analytics, because one counts per click and the other per session. Both views are shown here.
- The average conversion rate across Google and Microsoft Ads over the 12 months covered by the 2026 WordStream by LocaliQ report was 8.18%, with an average click-through rate of 6.64% (Search Engine Journal on the 2026 WordStream report).
- The 2025 edition put the Google Ads average at 7.52%, up from 6.96% in the previous calculation, with an average cost per lead of $70.11 (WordStream conversion rate benchmarks). Taken with the 2026 figure, the average rose from 6.96% to 7.52% to 8.18%.
- Paid search traffic converted at four times the rate of paid social traffic in Contentsquare's 2024 report, which analyzed more than 43 billion sessions across 3,590 websites. Visits from social were 41% more likely to bounce than visits from paid search (Contentsquare 2024 Digital Experience Benchmark).
To see how 9AM structures search budgets, read about our media buying service.
Paid Social Conversion Rate for Landing Pages
Paid social interrupts people who were not searching, so its landing page conversion rate is the lowest of the major channels. Platform-reported lead ad rates look much higher because the form stays inside the app. The data below separates the two and adds TikTok.
- Facebook ads benchmarks report a median conversion rate of 8.54% for campaigns using the Leads objective, with a median cost per lead of $27.39 and cost per click of $1.80. Traffic campaigns recorded a median click-through rate of 1.93% and cost per click of $0.60. The report includes 1,377 traffic campaigns and 452 leads campaigns. These figures describe campaign performance; the report does not establish that every lead was captured through an in-app form, so the 8.54% figure should not be treated as an exclusively Instant Forms or website landing page benchmark (WordStream Facebook ads benchmarks 2026).
- The 2024 edition, based on 2,946 campaigns run between February 2023 and April 2024, reported an 8.78% lead campaign conversion rate and a $21.98 cost per lead (WordStream Facebook ads benchmarks 2024). Cost per lead has risen about 25% since that edition.
- In site analytics, visitors from social ads converted at 0.61% in Q4 2023, down from 0.67% a year earlier, making paid social the only channel below 1%. Paid search converted at 2.55% in the same dataset, with bounce rates of 43.9% for paid search and 61.7% for paid social (MarketingCharts on Contentsquare data).
- TikTok ads converted at 1.56% in 2026 data from brands using Triple Whale, a 36.79% fall from the prior year. Cost per acquisition fell 31.36% to $17.07, and return on ad spend rose to 1.51 (Triple Whale TikTok ads benchmarks).
Because social visitors arrive without a search intent, the page has to carry more of the persuasion. Two 9AM resources cover that work: UGC briefs built to drive action and where marketers are moving budget away from Facebook Ads.
How Well Does Email Traffic Convert on Landing Pages?
Email sends visitors who already know the brand, so the question is less about the landing page and more about the type of message. Automated, behavior-triggered emails behave very differently from one-off campaigns. The benchmarks cover click behavior and what happens after it.
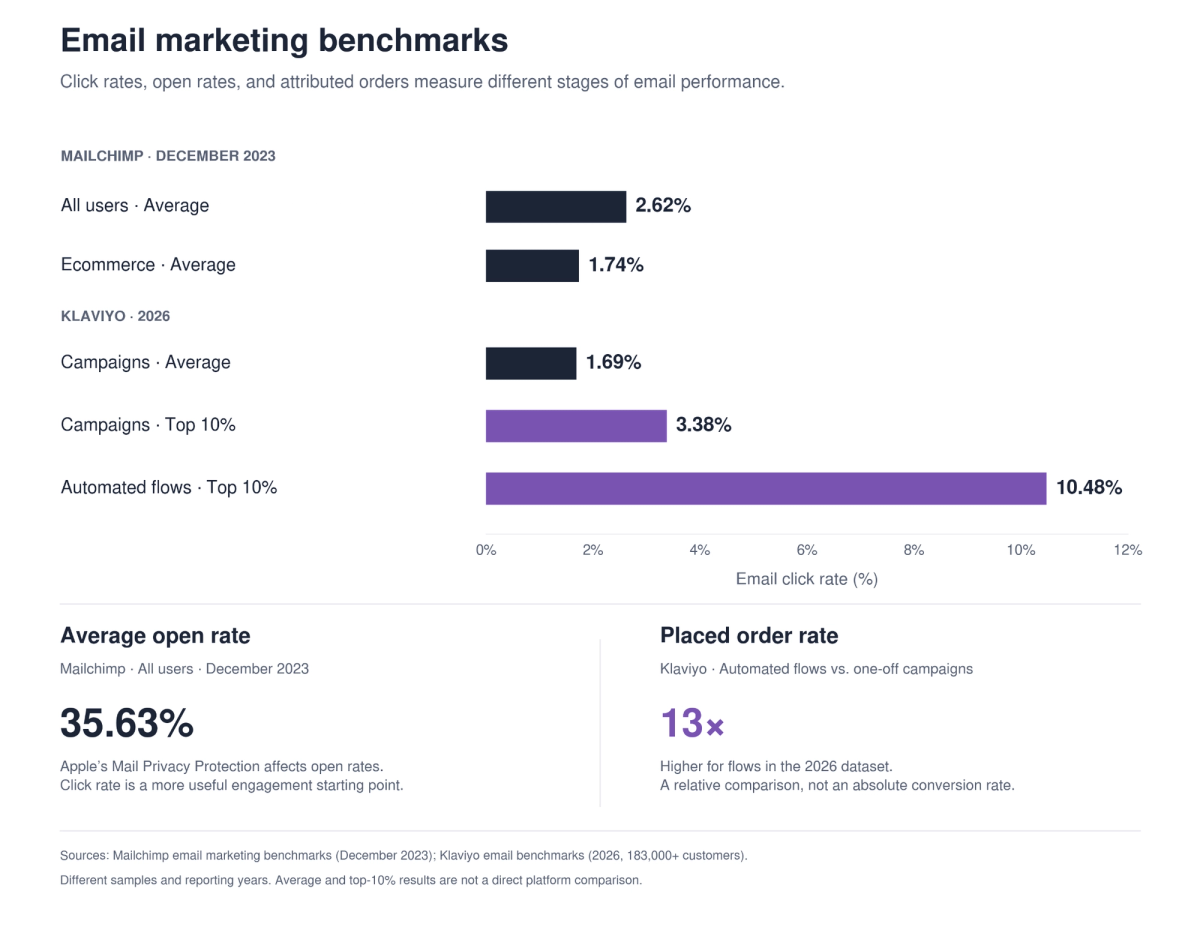
- Across all Mailchimp users, the average email click rate is 2.62% and the average open rate is 35.63%. Ecommerce senders average a 1.74% click rate (Mailchimp email marketing benchmarks, data as of December 2023). Open rates are affected by Apple's Mail Privacy Protection, so click rate is the safer starting point before the landing page.
- Klaviyo's 2026 benchmarks, drawn from more than 183,000 customers, show an average campaign click rate of 1.69% and a top-10% click rate of 3.38% for campaigns and 10.48% for automated flows. Flows also produce placed order rates 13 times higher than one-off campaigns. For the retention side of this channel, see our article on retention marketing for acquisition-focused teams.
Does AI Referral Traffic Convert Better Than Other Traffic?
Visitors from AI assistants arrive after the assistant has already summarized options, so they tend to land with clearer intent. Two large datasets measure this differently, one for US retail and one across industries. Read them as a direction of travel, not a single number.
- In July 2026, visits to US retail sites from AI referrals converted at a rate 60% higher than non-AI traffic, the 11th month in a row that AI traffic outperformed. AI referral traffic grew 62% year over year and 1,219% since October 2024 (Digital Commerce 360 on Adobe Analytics data).
- During the 2025 holiday season, AI referrals to US retail sites grew 693% year over year, and AI shoppers were 33% less likely to leave immediately. Adobe also reports that revenue per visit from AI traffic climbed 84% between January and July 2025 (Adobe Digital Insights).
- In October 2025, AI-referred visits produced 8% more revenue per session than other sources and had a 31% lower bounce rate. It was the second consecutive month in which AI traffic converted better than non-AI traffic (Adobe holiday shopping actuals, October 2025).
- The reversal was recent. In July 2025, an AI-referred retail visit was worth 27% less than a non-AI visit, compared with a 97% gap a year earlier (Mediaweek on Adobe data).
- Over the 2025 holiday season, revenue per visit from AI referrals rose 254% year over year, and AI-referred shoppers spent 45% more time on retail sites (Digital Commerce 360 holiday shopping analysis).
Across industries, Contentsquare's 2026 benchmark (cited in the baseline section above) puts AI-referred conversion at 1.3%, up 55% year over year and the only channel that grew from Q4 2024 to Q4 2025. That is above organic social (0.7%) and below paid search (2.8%).
These findings describe different comparisons.
Contentsquare reports an absolute AI referral conversion rate across industries, while Adobe reports how much higher the rate was for AI-referred US retail visits than for non-AI visits. Both show improvement in AI referral conversion, but the different metrics, industries, and reporting periods prevent a direct numerical comparison.
For a view of how advertising is entering these platforms, check out this list of ChatGPT Ads agencies.
How Do Landing Page Conversion Rates Differ by Industry?
Industry changes conversion rates more than most teams expect, because buying cycles, price points, and the action being counted all differ. A benchmark from the wrong industry can make a healthy page look weak. Use the figures below to find the closest peer group.
- In WordStream's 2026 search ads benchmarks, conversion rates varied from 2.64% in finance and insurance to 13.14% in education and instruction and 16.22% in animals and pets. Attorneys and legal services converted at 5.55%, travel at 5.83% and business services at 4.85%. The data covers 13,474 US search campaigns across 23 industries between April 2025 and March 2026, reported as medians, and conversion rates rose in 87% of industries (WordStream Google Ads benchmarks 2026).
Use the industry figure for your own category, not the cross-industry median, whenever one is available.
Page Speed Effects on Landing Page Conversion Rates
Page speed affects conversion in every channel, because slow pages lose visitors before they see the offer. The effect is strongest on mobile and in ecommerce. These studies measure it in different ways, so compare the direction across them.
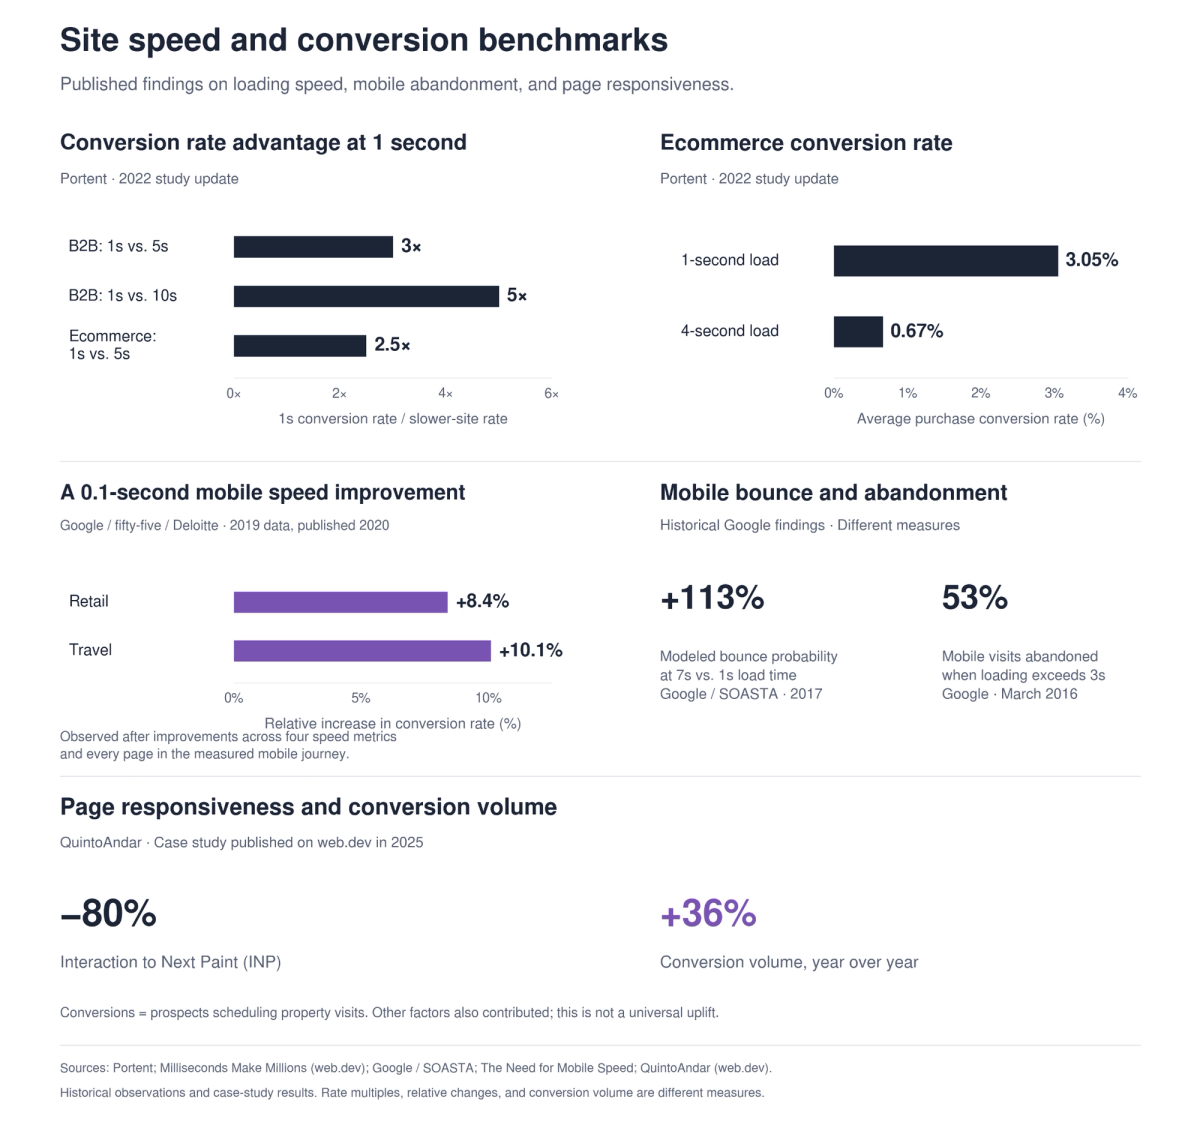
- A B2B site that loads in one second converts at three times the rate of a five-second site and five times the rate of a ten-second site. For ecommerce, the one-second advantage over five seconds is 2.5 times, and the average ecommerce conversion rate falls from 3.05% at one second to 0.67% at four seconds (Portent site speed study).
- A 0.1 second improvement in mobile load time raised conversion by 8.4% for retail sites and 10.1% for travel sites in a study commissioned by Google and run by fifty-five and Deloitte, which monitored mobile load times for 30 days at the end of 2019 (Milliseconds Make Millions on web.dev).
- In Google research from 2017, the probability of a mobile visitor bouncing rose 113% as load time went from one second to seven seconds, and 53% of visits were abandoned when a mobile page took longer than three seconds (Think with Google mobile page speed benchmarks). The dataset is old, but it is still the most cited source for this effect.
- A 2025 case study published on web.dev provides a more recent example. QuintoAndar reduced Interaction to Next Paint, a measure of page responsiveness, by 80% and reported a 36% year-over-year increase in conversion volume, defined as prospects scheduling property visits. The authors connect the increase partly to improved user experience, while acknowledging other contributing factors. This is a company-specific result, so it’s not a conversion uplift every site should expect (QuintoAndar web performance case study).
Why a Higher Conversion Rate Doesn’t Always Mean Better Results
A higher conversion rate tells you that more visitors completed the action you measured. To understand its business value, follow what happens after that action. Form submissions need to become qualified opportunities; purchases need to generate enough margin to justify the cost of acquiring them.
For lead generation, removing qualification questions may increase submissions while attracting more people your sales team cannot serve. The page looks stronger in analytics, but the team spends more time reviewing unsuitable leads.
Consider this hypothetical example:
| Metric | Page A | Page B |
|---|---|---|
| Visits | 1,000 | 1,000 |
| Form conversion rate | 5% | 3% |
| Leads generated | 50 | 30 |
| Share of leads meeting qualification criteria | 20% | 60% |
| Qualified leads | 10 | 18 |
Page B generates 18 qualified leads from the same number of visits, compared with 10 for Page A. Its lower form conversion rate produces more potential sales opportunities. Before choosing a winner, compare acquisition costs and follow those leads through to customers, using consistent qualification criteria and follow-up periods.
For ecommerce, the same principle applies to purchase value. A discount can increase orders while reducing the margin on each sale. Evaluate revenue per session alongside contribution margin after discounts, returns, fulfillment, and acquisition costs.
Pair the conversion rate with metrics that show what those conversions become:
- Lead generation: qualified leads per visit, cost per qualified lead, and lead-to-customer rate.
- Ecommerce: revenue per session, customer acquisition cost, and contribution margin.
- Trials and sign-ups: activation rate, conversion to paid customers, and retention.
Before running a test, define the downstream result you need to protect. If form submissions increase, qualified opportunities should hold up. If purchase conversion improves, check whether the additional orders contribute profit. Give those outcomes time to develop before deciding whether the higher conversion rate represents a useful improvement.
How to Use Conversion Benchmarks to Improve Your Landing Pages
Use benchmarks in four steps: segment your conversion rate by source, confirm your tracking, match each page to the intent of its source, and set targets against a comparable peer group. Review the gap every quarter.
Watch this video on conversion rate optimization:
Or follow the steps below:
- Segment your conversion rate by source before comparing to anything. Compare email to email and paid search to paid search, using the same conversion definition the benchmark uses.
- Check your tracking first. Platform-reported and analytics-reported conversion rates differ, and gaps in tracking distort any benchmark comparison. We explain the technical side in our guide to server-side tracking for paid media teams.
- Match the page to the intent of each source. A cold social visitor needs a different page from a branded search visitor. Testing that match is the job of a repeatable system, described in our article on creative testing solutions.
- Set targets against a peer group. If your page converts at 3% and a comparable peer group sits at 6%, aim for the next step (comparing yourself with the top of the range is a mistake). Review the gap per source every quarter, since these datasets update annually or more often.
To review your own source-level conversion rates with a specialist, book a strategy call with 9AM.
Frequently Asked Questions
What is a good landing page conversion rate?
Across industries, Unbounce reports a 6.6% median and HubSpot cites 5.89% as the average, with 10% treated as a good rate. The comparison that matters is your own industry and traffic source, because the same page can sit well above the median for one source and well below it for another.
Which traffic source converts best?
It depends on the industry and the conversion definition. In Contentsquare's 2026 data, paid search has the highest rate of the paid channels at 2.8%, and in its 2024 data paid social had the lowest. In Klaviyo's data, automated email flows convert at 13 times the order rate of one-off campaigns.
Does AI referral traffic convert better than other traffic?
In US retail, Adobe reports that it does, by 60% in July 2026. Contentsquare's cross-industry data shows a lower absolute rate of 1.3% that is growing quickly. Measure AI referrals as their own segment in your analytics before drawing conclusions.
Why do paid social conversion rates look so low?
Social ads interrupt people who were not searching for the offer. Contentsquare found those visits are 41% more likely to bounce than paid search visits. Lead ads that keep the form inside the platform report higher rates, but they measure a different action.
Sources and Methodology
All figures are quoted from the sources linked in each section. Datasets differ in region (most are US-based), time period, sample size, and conversion definition, and several are published by software vendors.