


Every growth team hits the same moment. Acquisition is ready to spend more, and the retention lead is still waiting on the number that decides how far that spend can go: lifetime value.
The good news is that most of that number arrives early. In Recharge's subscription data, about 61% of voluntary cancellations happen in the first two renewals, and roughly 72% within four. The data that matters for customer acquisition decisions shows up within weeks, as long as you know which data to read.
This guide covers the minimum LTV data to scale on, how that minimum changes by business model, and how to raise spend in steps while the rest of the picture fills in.
P.S. If you'd rather have someone build the cohort model with you, our analytics and measurement team runs CAC and LTV analysis for brands scaling paid media.
TL;DR
- You need three things before scaling: one observed repurchase or renewal cycle, enough first-time buyers per cohort to put a confidence range on LTV, and three consecutive cohorts that agree.
- Scale on contribution-margin LTV, and size spend to the low end of the LTV confidence range.
- Ad platforms have their own minimums: Google's tROAS needs at least 15 conversions in 30 days, and Meta's predicted LTV feature needs 100 conversions a week for four weeks.
- Your business model sets the wait. A coffee subscription can read LTV after one renewal; a high-ticket brand should scale on first-order margin.
- Raise spend in stages, and let each new cohort read unlock (or block) the next step.
Our view, before the mechanics: we run media, creative, and measurement as one loop, because each one changes the others. Media buying is where an idea meets real customers, and measurement decides what earns the next dollar. That makes LTV a working tool for the weekly budget call. Treat it as a finance report you check once a year and you'll either wait too long or scale on a number nobody trusts. We judge accounts on CAC and MER and we treat spend that teaches you nothing as the real waste. Waiting a year for a perfect LTV teaches you nothing for a year.
What Is the Minimum LTV Data Needed to Scale?
You need one full repurchase or renewal cycle, enough first-time buyers per cohort to put a confidence range on LTV, and three consecutive cohorts whose early reads agree. Miss any one of the three and the LTV number is a guess with a decimal point.
These are the working thresholds we use across client accounts. There's no industry standard here, and these hold up across subscription, replenishment, and app businesses because each one guards against a different failure:
- Cohort maturity guards against reading LTV before customers have had a chance to come back.
- Cohort volume guards against a small sample that looks precise but swings by several points from month to month.
- Cohort stability guards against one unusually good month setting your CAC targets for a year.
| Threshold | What it means | Minimum to start scaling | What to do if you don't have it yet |
|---|---|---|---|
| Cohort maturity | Customers have had time to repurchase or renew at least once | One full cycle observed (first renewal, or 1.5x the typical reorder interval) | Scale on first-order contribution margin only |
| Cohort volume | Enough first-time buyers that the LTV confidence range is narrow | A range narrower than your CAC margin of safety (often 250-400+ buyers per cohort) | Pool weekly cohorts into monthly ones |
| Cohort stability | Early-to-late LTV multiplier holds across cohorts | Three consecutive cohorts within roughly 10-15% of each other | Hold spend flat and keep reading |
Even large samples carry error. In Eric Seufert's foundational simulation for app LTV, 90,000 users spread across 180 daily cohorts still left about a 6.5% error margin on D90 LTV at 95% confidence.
"Enough data" is always a range you can act on.
So the practical question changes from "do we know LTV?" to "is the low end of our LTV range above the CAC we're about to pay?" The rest of this article is how to answer that.
Why Waiting for 12-Month LTV Costs More Than It Protects
A full 12-month LTV buys very little extra precision, because most of the information about customer retention arrives in the first one or two cycles. The later months mostly confirm what the early ones already showed.
The churn data makes this clear:
- In Recharge's subscription data, churn is 24.1% at the second order cycle and peaks at 27.1% at cycle three, then falls to 5.4% by cycle twelve.
- RevenueCat's 2026 report found that 35% of all annual-plan cancellations happen in month one, with only 3-7% a month through months three to eleven.
- Seufert's simulation estimated that getting under a 10% error on D365 LTV takes roughly 455 days of data collection.
Put those together and the trade-off is lopsided. The extra months shave a few points off your error, and you pay for them with a year of flat spend, frozen creative learning, and a competitor who started compounding while you waited.
There's a real risk on the other side, too. A brand that scales on a single D30 read can lock in a CAC its customers never pay back. The answer is a decision date per cohort, set at the end of its first repurchase or renewal cycle, with spend sized to what that read can support.
Small, well-read steps also compound. Over a three-year-plus partnership with Genomelink, steady testing across 70+ new assets a month and 5+ channels cut customer acquisition cost by 77%. That result came from years of small scaling calls, each one checked before the next.
What to do: add a "decision date" column to your cohort sheet. For each acquisition month, it's the date the first cycle completes. That's when the cohort's LTV read becomes eligible to change your CAC target, and not before.
Which LTV Data Points Should Gate Customer Acquisition Spend?
Four LTV data points should decide acquisition spend: realized LTV at fixed cohort days, contribution-margin LTV, the first-cycle repurchase or renewal rate, and LTV split by channel and first product. Each one answers a different question, and growth and retention teams usually own different halves.
Realized LTV by Cohort Day (D30, D60, D90)
Realized LTV is the cumulative revenue per first-time buyer, read at fixed days from their first order. Read it at D30, D60, and D90 for every acquisition-month cohort.
Never compare cohorts on "LTV to date." A January cohort read in October has had nine months to buy; a July cohort has had three. Fixed days make cohorts comparable and make the curve's shape visible.
Contribution-Margin LTV
Contribution-margin LTV subtracts cost of goods, shipping, payment fees, returns, and discounts from revenue. It's the only version of LTV that can pay back CAC.
Revenue LTV overstates the budget you can afford, often by a wide margin for brands with heavy shipping costs or a low gross margin.
- Build both columns, and set CAC targets from the margin column only.
- Then check blended marketing efficiency ratio (MER) to see how total revenue compares with marketing spend.
- Validate the margin assumptions separately with finance, using actual product costs, shipping, payment fees, returns, and discounts.
First-Cycle Repurchase or Renewal Rate
The first-cycle rate is the share of first-time buyers who place a second order (or renew once) within one expected cycle. It's usually the single most predictive early number in the whole model.
Customers who come back once are far more likely to come back again, so this rate does most of the work in any early LTV forecast. It's also the number retention teams can move fastest with onboarding, post-purchase flows, and offer design.
LTV by Acquisition Channel and First Product
Channel-level LTV shows whether the customers each channel brings in are worth the same. They rarely are. A cohort acquired through a discount-heavy prospecting campaign behaves differently from one acquired through branded search.
Split by first product too, because the first product often sets the reorder rhythm. Just remember that channel cohorts depend on attribution, and last-click attribution over-credits the bottom of the funnel, which inflates LTV for the channels that close and deflates it for the ones that open.
| Data point | Question it answers | Minimum read before scaling | Usual owner |
|---|---|---|---|
| Realized LTV at D30/D60/D90 | How fast is value arriving? | Three cohorts at the same fixed day | Growth |
| Contribution-margin LTV | How much CAC can we pay back? | Margin inputs agreed with finance | Growth + finance |
| First-cycle repurchase/renewal rate | Will customers come back? | One full cycle, with a confidence range | Retention |
| LTV by channel and first product | Where should the next dollar go? | 250+ first-time buyers per channel cohort | Growth + retention |
How LTV Data Requirements Differ by Business Model
Your business model decides how long the wait is. Subscription brands can read LTV after one renewal, replenishment brands after one reorder window, and one-time-purchase brands should mostly stop waiting and scale on first-order margin.
Subscription Ecommerce
Wait for the first renewal before you trust a subscription LTV. The churn rate is front-loaded and plan length changes it sharply: Recharge found a cumulative churn of 84.2% for monthly plans compared with 30.1% for annual plans, and the average churning monthly subscriber was gone by about day 77.
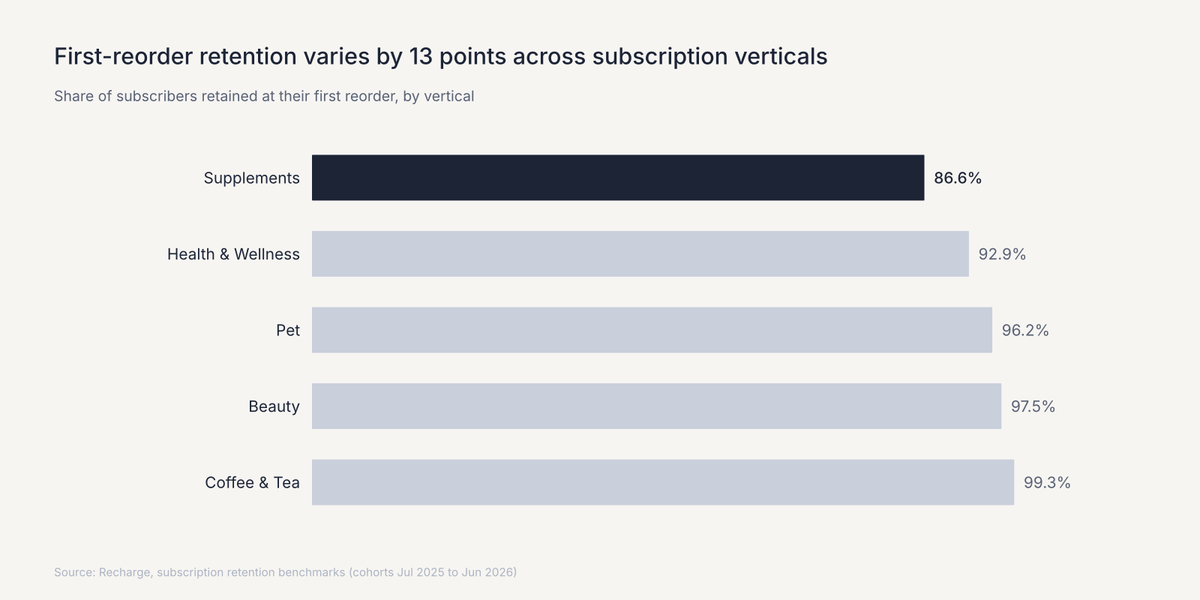
Vertical matters as much as plan type. First-reorder retention in Recharge's data runs from 86.6% in supplements to 99.3% in coffee and tea. A supplement brand needs a wider safety margin on its first read than a coffee brand does.
Replenishment and Consumables
Wait one replenishment window, then read the repeat rate at 1.5x the expected reorder interval. If a product runs out in about 30 days, read the cohort at day 45, which gives late reorderers time to show up without stretching the wait.
The common mistake here is reading a 60-day product at day 30 and concluding the repeat rate is terrible.
One-Time or High-Ticket Purchases
Scale on first-order contribution margin, and treat any repeat revenue as upside. If most customers buy once (furniture, appliances, mattresses), LTV is mostly the first order, and waiting for repeat data delays spend for little gain.
Track repeat behavior anyway, because accessories and referrals add up. Just don't let them justify a CAC the first order can't cover.
Subscription Apps
Read trial conversion and month one before anything else. RevenueCat found that 55.4% of cancellations on 3-day trials happen on day zero, and first-year retention on annual plans fell to 28% in 2024. Most of the app LTV answer is decided in the first days and the first renewal.
| Business model | Event that must be observed | Earliest credible read | Early proxy to watch |
|---|---|---|---|
| Subscription ecommerce | First renewal | After cycle 2 | Skip and pause rate before the first renewal |
| Replenishment/consumables | Second order | 1.5x the reorder interval | Post-purchase email engagement, subscription opt-in |
| One-time/high-ticket | First order margin | At purchase | Return rate within the return window |
| Subscription app | Trial conversion and first renewal | Day 7 for trials, month 2 for monthly plans | Activation events in the first 24-72 hours |
Retention tactics that raise these numbers are their own topic, covered in our guide to retention marketing for acquisition teams. This section is only about how long to wait before the data is trustworthy.
How to Check Whether Your LTV Sample Is Big Enough
Your sample is big enough when the low end of the LTV confidence range still clears your CAC target. You can check that with basic cohort analysis and one formula, in five steps:
- Count first-time buyers per cohort. Exclude returning customers, who would inflate both repeat rate and LTV.
- Calculate the first-cycle repurchase or renewal rate. Divide buyers who came back within one cycle by total first-time buyers.
- Put a 95% confidence range on that rate. Take the rate times one minus the rate, divide by the number of buyers, take the square root, and multiply by 1.96. That's the plus-or-minus around your rate.
- Convert both ends of the range into contribution-margin LTV. Run the low rate and the high rate through your LTV model separately.
- Compare the low end to your CAC target. Scale only if the low end clears it.
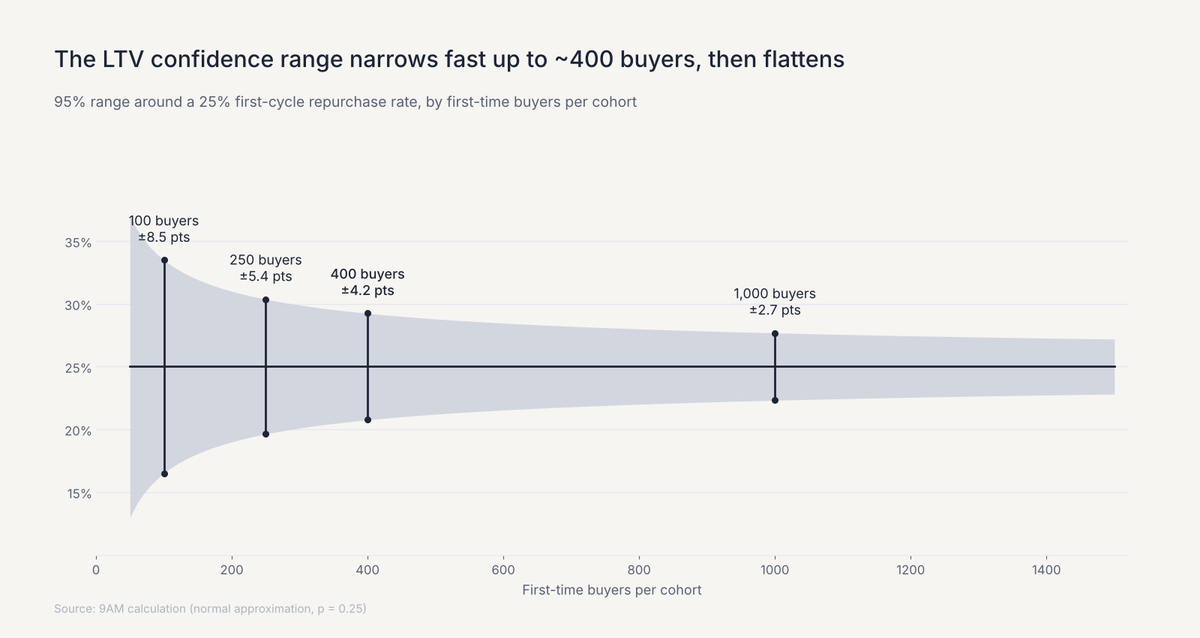
Cohort size changes the width of that range more than most teams expect:
| First-time buyers per cohort | 95% range on a 25% repurchase rate | What it supports |
|---|---|---|
| 100 | 16.5% to 33.5% (±8.5 pts) | Directional only, don't change CAC targets |
| 250 | 19.6% to 30.4% (±5.4 pts) | Small, capped spend increases |
| 400 | 20.8% to 29.2% (±4.2 pts) | Stage-based scaling with a CAC cap |
| 1,000 | 22.3% to 27.7% (±2.7 pts) | Channel-level targets and value-based bidding |
Here's a good illustration. Say first orders earn $30 in contribution margin, returning customers add another $70 of margin over 180 days, and your CAC target is $45. With 400 buyers and a 25% repurchase rate, the range on LTV runs from about $44.60 to $50.40. The point estimate ($47.50) clears the target, but the low end doesn't. At 1,000 buyers, the low end rises to $45.60 and the same cohort now supports scaling.
Pro tip: when weekly cohorts are too small, pool them into monthly ones before you read the rate. Wide confidence intervals in small weekly cohorts are a sign you're looking at noise.
How to Predict LTV Early Without Waiting a Year
You can predict LTV early by building an early-to-late LTV multiplier from your own mature cohorts, then applying it to new cohorts with its error band. A model trained on your customers beats any industry benchmark, it improves every month you feed it, and it's the same cohort logic that powers a paid media revenue forecast finance will actually use.
The basic method takes four steps:
- Pick your mature cohorts. Use acquisition months that have at least six months of history.
- Calculate the multiplier. Divide each cohort's D180 realized LTV by its D30 realized LTV.
- Check stability. If three consecutive cohorts land within about 10-15% of each other, the multiplier is usable.
- Apply it with the band. Multiply a new cohort's D30 LTV by both the lowest and the highest recent multipliers.
Inputs matter as much as the method. First-order average order value, discount depth, and first product all shift the multiplier, so log them per cohort.
When you outgrow simple multipliers, there are more formal options:
- BTYD models (BG/NBD, Pareto/NBD): these need only three numbers per customer, namely how recently they bought, how often, and how long you've observed them. Fader, Hardie and Lee's BG/NBD paper is the foundational reference.
- Shifted-beta-geometric (sBG) models: built for subscriptions, they project retention and LTV from a series of past cohort retention counts.
- GA4 predicted revenue: free, but gated. Google requires at least 1,000 returning users who purchased and 1,000 who didn't within a seven-day window over the last 28 days.
Whatever you use, validate it every month against realized cohort revenue. A prediction nobody checks drifts quietly until a budget review exposes it. Once a model has held up for a few cohorts, our media buying team can wire it into bidding, which is where the platform requirements below come in.
What Meta and Google Need Before LTV Data Can Steer Bidding
Ad platforms need conversion volume and varied conversion values before they can bid on LTV, and those requirements are separate from whether your LTV model is any good. You can have a trustworthy LTV and still not qualify for value-based bidding on your main marketing channels.
Plan for both tracks at once. Start the platform setup while the LTV model is still maturing, so bidding is ready the week the data is.
| Platform feature | Minimum data | What to send | Source |
|---|---|---|---|
| Google target ROAS (Search/Shopping) | 15+ conversions in the past 30 days; values reported for 4 weeks or 1-2 conversion cycles | Conversion value per order | Google Ads Help |
| Google value-based bidding | 2+ different values; 3 weeks or 1-2 cycles of values; conversions sent within 7 days (recommended but not mandatory) | Varied values, no backfilling | Google Ads Help |
| Google customer lifecycle goals | Customer lists with 100+ active members; autodetection uses up to 540 days of data | First-party customer lists | Google Ads Help |
| Meta value optimization | 30 attributed purchases with 5+ distinct values in the past 14 days | Purchase value | Reported by Jon Loomer |
| Meta predicted LTV (Conversions API) | 100 conversions a week for 4 weeks; 5+ distinct pLTV values with the highest at least 3x the lowest | pLTV within 7 days of the conversion | Meta for Developers |
Three points matter more than the table suggests:
- Google's new customer value mode lets you bid higher for new customers. It's the cleanest way to put an LTV premium into Search and Shopping without a full pLTV pipeline.
- Meta's pLTV feature needs about two weeks for its models to train after integration checks pass, supports web events only, and depends on clean server-side tracking.
- Send contribution-margin values where you can. If you send revenue, the platform will happily chase high-revenue, low-margin orders.
Because of that second point, server-side event setup usually comes before value-based bidding in our roadmaps.
When to Scale Acquisition: A Spend Ladder Tied to LTV Confidence
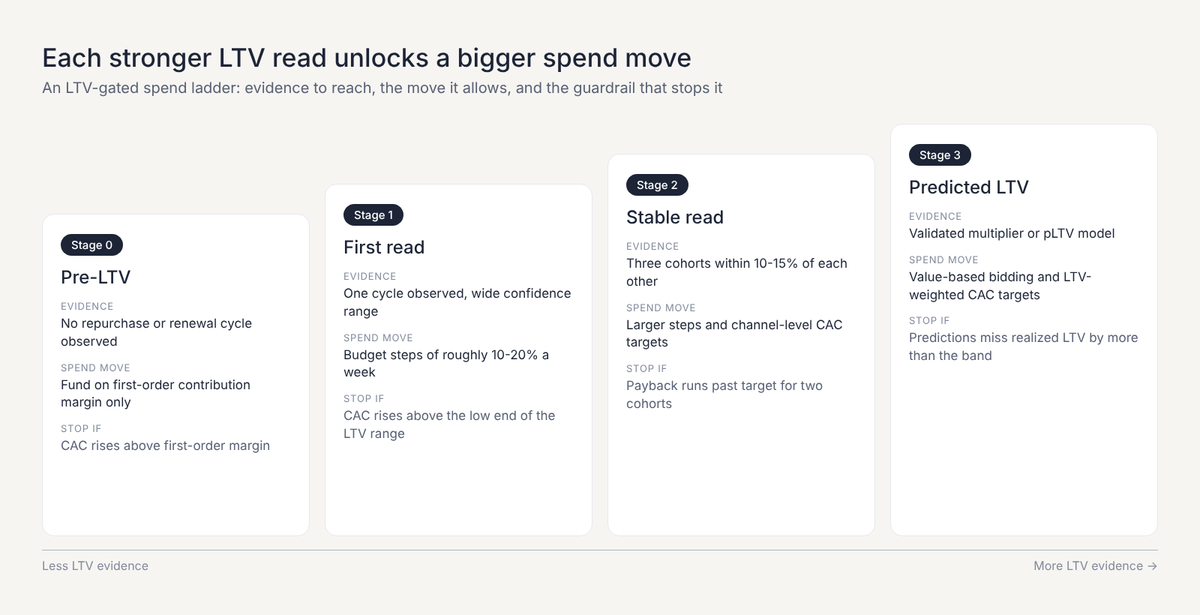
Scale in stages, and let each stronger LTV read unlock the next step. Each stage below has an evidence bar to reach, a spend move it allows, and a guardrail that stops it.
| Stage | LTV evidence in hand | Spend move | Guardrail that stops the step |
|---|---|---|---|
| 0. Pre-LTV | No repurchase or renewal cycle observed | Fund on first-order contribution margin only | CAC above first-order margin |
| 1. First read | One cycle observed, wide confidence range | Raise budgets in steps of roughly 10-20% a week | CAC above the low end of the LTV range |
| 2. Stable read | Three cohorts within 10-15% of each other | Larger steps; set channel-level CAC targets | Payback period past target for two cohorts |
| 3. Predicted LTV | Validated multiplier or pLTV model | Value-based bidding; LTV-weighted CAC targets | Predictions miss realized LTV by more than the band |
The 10-20% weekly steps come from our own accounts, and they sit on top of the guardrail metrics for scaling paid media you'd watch at any budget level. Steps of that size give each cohort time to read before the next increase, and in our experience they keep Meta and Google out of extended re-learning.
Payback period is the cash guardrail at every stage.
LTV:CAC tells you whether a customer is profitable eventually, while payback tells you whether you can afford to wait for it. A cohort can clear a healthy ratio on paper and still drain cash for a year.
The familiar benchmarks of an LTV:CAC above 3 and CAC recovered in under 12 months come from SaaS. DTC brands usually need faster payback because inventory ties up cash too.
Our guide to modeling CAC payback for DTC covers that calculation in full.
Two more guardrails keep the ladder honest while you climb it:
- Blended efficiency. Watch marketing efficiency ratio (MER) alongside channel CAC, so a platform's attribution can't make a step look cheaper than it was.
- Leading indicators. Creative fatigue, frequency, and click quality usually move before CAC does, so set alerts on them and pause a step when two of them turn at once.
LTV Data Mistakes That Break Scaling Decisions
Most failed scaling decisions trace back to a handful of LTV data mistakes, and nearly all of them come from trusting an average. As Wharton's Peter Fader put it, focusing on "the average customer" ignores the vast heterogeneity across customers.
| What you see | Likely cause | What to check |
|---|---|---|
| Blended LTV looks healthy, but new cohorts underperform | Older, better cohorts are propping up the average | LTV at a fixed day, cohort by cohort |
| LTV jumps after a sale | Discount-acquired buyers are mixed in with full-price buyers | Split cohorts by first-order discount depth |
| Channel LTV contradicts platform ROAS | Attribution is over-crediting one channel | Run an attribution model audit before moving budget |
| The multiplier stops predicting | A price, offer, or product mix change | Rebuild the multiplier from post-change cohorts only |
| CAC looks unusually low | Returning customers are counted as new | New-customer flags in your order data |
The fix for each one is the same habit: keep cohorts narrow, label them with what changed, and re-check the LTV read every time the acquisition mix shifts.
Scale Acquisition on LTV Data You Can Trust with 9AM
Scaling acquisition doesn't require a perfect LTV. It requires an honest one: a range built from enough first-time buyers, read at the right point in the cycle, and checked against what customers actually spent.
That's how we run growth programs at 9AM.
Media buying, creative, and measurement sit in one team, so the cohort read that comes out of measurement goes straight into next week's budget and next month's creative brief. The result is a spend plan that grows as fast as the LTV evidence allows, and no faster.
If you want a second set of eyes on your numbers, book a strategy call. We'll review your cohort data, put a confidence range on your current LTV, and map out the first steps of a spend ladder your finance team can sign off on.
FAQs
Should a Black Friday cohort count toward the LTV data you scale on?
Keep it as its own cohort and leave it out of the multiplier you use for evergreen spend. Black Friday buyers usually arrive on deeper discounts and often repeat at different rates, so blending them in can drag down or inflate the read for months. Use the cohort to set next year's promotional CAC cap instead.
Can LTV data from one market justify scaling in a new geo?
Only as a starting assumption. Price sensitivity, shipping costs, and competition change contribution-margin LTV by market, so treat the new geo as Stage 0 or Stage 1 on the ladder. A geo-lift test is a clean way to check incremental demand before you commit a full budget.
How often should the early-to-late LTV multiplier be rebuilt?
Re-check it every month as a new cohort matures, and rebuild it whenever price, offer structure, or the main acquisition channel changes. If the newest cohort lands outside the band of the previous three, treat that as a rebuild signal even if nothing obvious changed.
Who should own the LTV number used for acquisition targets?
Retention should own the inputs and growth should own the CAC targets built on them, with finance signing off on the margin assumptions. When one team owns the whole chain, the number tends to drift toward whatever that team needs it to say.