

Paid media got more expensive in 2026 without getting proportionally better. Median CPMs climbed about 13% on both Meta and Google, Google's available impression pool shrank, and Amazon's cost of reach rose faster than either.
The averages hide the part that matters most for planning: an account spending $8,000 a month and an account spending $800,000 a month do not face the same auction, the same testing math, or the same efficiency ceiling.
This page collects the 2026 benchmarks that break performance out by spend level, then fills in platform, cost, and measurement data around them. Every figure links to its source.
Key Paid Media Benchmarks for 2026
| Benchmark | 2026 figure | Section |
|---|---|---|
| Google Ads ROAS, $10K to $50K/month accounts | 565.8% (vs 377.3% at $50K+) | ROAS by spend tier |
| Blended ecommerce CAC, sub-$1M vs $100M+ revenue brands | $95 vs $55 midpoint | CAC by spend tier |
| CAC increase after any Meta budget increase | 5% to 6% for about 10 days | Efficiency at scale |
| Ad spend as a share of revenue, sub-$1M vs $50M+ brands | 25% to 35% vs 7% to 15% | Ad spend by stage |
| Meta median CPM | $15.06, up 13.24% | Meta benchmarks |
| Amazon median CPM | $8.08, up 39.18% | Amazon benchmarks |
| Weekly new creatives, under $10K vs $1M+ monthly Meta spend | 2.8 vs 18.9 | Creative testing |
| Meta acquisition share of spend, under $50K vs $1.5M+ per quarter | 49.8% vs 59.0% | Channel mix |
| Google brand search ROAS, platform-reported vs incremental | 19.07x vs 5.72x | Channel mix |
How we define spend tiers
Sources cut spend differently, so this page uses four working tiers and states each source's own band where it differs.
| Working tier | Monthly paid media spend | How the main sources band it |
|---|---|---|
| Emerging | Under $10K | Optmyzr SMB; Motion Micro |
| Growth | $10K to $50K | Optmyzr Mid-Market; Motion Small |
| Scale | $50K to $250K | Optmyzr Enterprise starts at $50K; Motion Medium ($50K to $200K) |
| Enterprise | $250K and up | Motion Large ($200K to $1M) and Enterprise ($1M+) |
Common Thread Collective reports spend tiers per quarter, and Eightx reports by annual revenue. Those figures are labeled in their own terms below.
What Is a Good ROAS for Paid Media? ROAS Benchmarks by Spend Tier
A good ROAS depends on spend tier first and platform second: Google Ads accounts spending $10K to $50K a month return the most per dollar, and the largest accounts return the least.
- Mid-market Google Ads accounts ($10K to $50K a month) delivered 565.8% ROAS in Q1 2026, against 387.8% for accounts under $10K and 377.3% for accounts above $50K, across 21,425 accounts tracked by Optmyzr.
- Enterprise Google Ads accounts saw ROAS slide from 391.4% to 377.3% over five quarters while CPA rose from $14.26 to $16.00 without a single quarterly decline, per the same Optmyzr study.
- Health and fitness advertisers run a Google Ads category baseline of 295.7% ROAS, well below the 430.9% platform average, which makes the platform figure a misleading target for that vertical, per the same Optmyzr study.
- Varos's April 2025 data, which skews toward larger advertisers, puts median ROAS at 2.19x on Meta and 3.31x on Google Ads across 28 industries, as compiled by Superscale.
- Triple Whale's 21,000-brand Google panel returns a 3.27 median ROAS against 1.51 for its 5,900-brand TikTok panel, as compiled by Top Growth Marketing, a roughly 2x spread in returns before any vertical adjustment.
- Break-even ROAS equals 1 divided by gross margin, so a business on a 30% margin needs at least 3.33x to break even on advertising, per Silverback Marketing's 2026 Paid Media Benchmark Report.
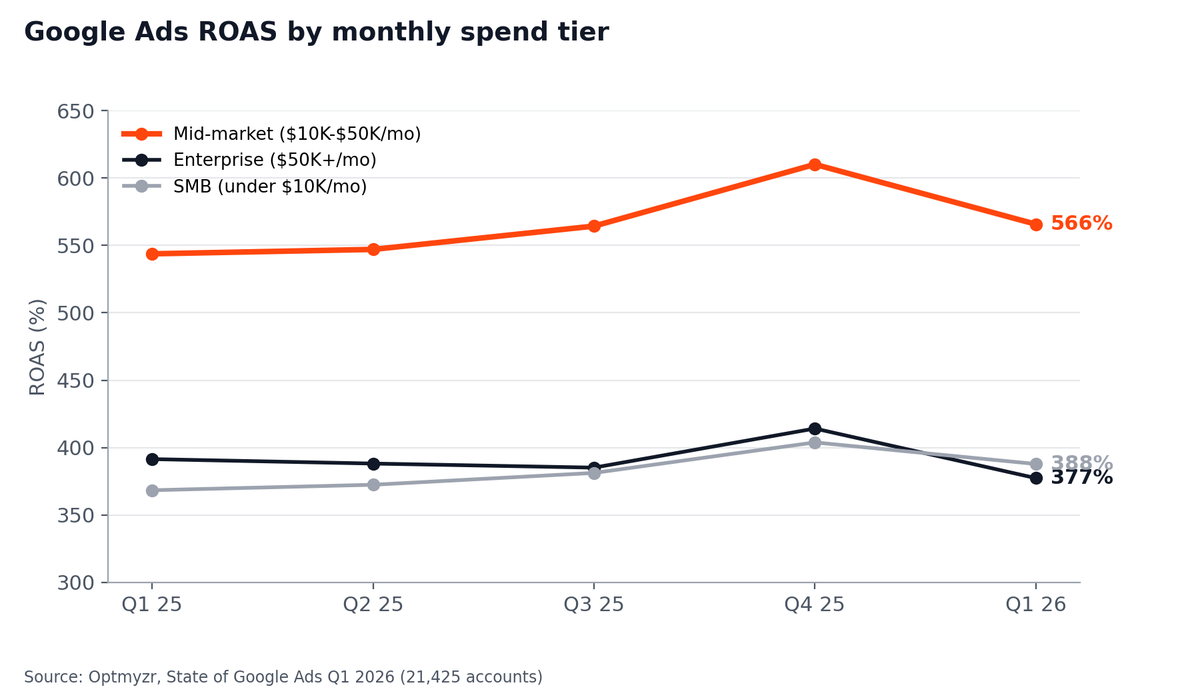
What this means: The number to watch is the mid-market Google premium. In Q1 2026, $10K to $50K accounts returned 46% more per dollar than SMB accounts and 50% more than enterprise accounts, and they led both tiers in every one of the five quarters Optmyzr tracked. Optmyzr’s explanation is that SMB budgets cap how much of their strong engagement turns into results, while enterprise accounts bid into costlier competitive auctions where each extra impression is worth less. The two Meta medians on this page also disagree (Varos at 2.19x, Triple Whale at 1.88x), and the panels differ in advertiser mix and time period, so that gap says little about spend tier on its own. Set targets from your own break-even ROAS first, then use the tier figures to see whether your account is under-delivering for its size; our MER guide covers the blended version of that target.
CAC and CPA Benchmarks by Spend Tier: What Each Customer Costs
Blended customer acquisition cost falls as brands grow, but the decline is uneven, so the cross-industry median is a poor benchmark for most brands.
- Blended ecommerce CAC sits at a $95 midpoint for brands under $1M in revenue, $80 for $1M to $5M, $75 for $5M to $20M, $68 for $20M to $50M, $63 for $50M to $100M, and $55 for $100M+, according to Eightx’s own estimates (synthesized from Polar Analytics, Shopify, and SEC filing data because no public dataset breaks CAC out by these bands at the time of this writing).
- Polar Analytics' 4,000-brand Shopify panel flags the $5M to $20M band as the worst CAC-efficiency tier, the point where organic growth stops scaling and brand demand has not arrived, as reported in the same Eightx analysis.
- CAC inflation runs regressive in the same Eightx data: brands under $1M face 20% to 30% annual CAC increases heading into 2026, while $100M+ brands absorb 8% to 18%.
- Shopify merchant-wide fully loaded CAC rose from $274 to $318, a 16.1% annual increase that includes agency fees, tooling, and discounts, as cited in the same Eightx analysis.
- B2B SaaS companies selling contracts above $150K ACV target an $8,000 to $20,000 cost per sales-qualified lead on Google Ads, with recommended spend of $75K to $250K a month, per GrowthSpree's data from 300+ SaaS accounts.
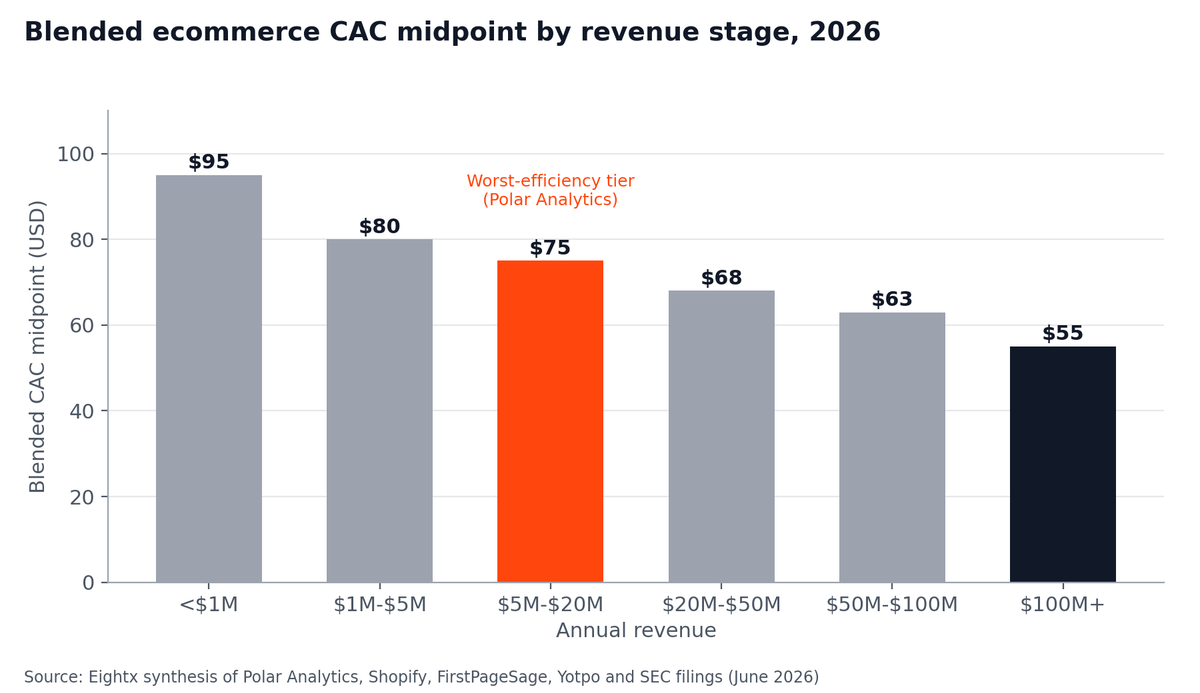
What this means: Eightx describes this curve as a U-shape, yet its own midpoints decline at every step. The “dead zone” label for the $5M to $20M band comes from Polar Analytics’ qualitative read that efficiency is worst there, and it does not show up as a higher dollar figure. Eightx’s interpretation is that brands in this band have outgrown cheap organic acquisition before brand demand arrives, so order value, retention, and wholesale tend to move CAC further than bid changes do. Our blended vs paid CAC breakdown covers which of the two numbers to scale on.
Paid Media Efficiency at Scale: Where Returns Start to Drop
Scaling has a measurable cost, but it is smaller and more predictable than most teams assume.
- Raising a Meta budget lifted CAC by 5% to 6% for the following week at every jump size, whether +10% or +50%, across 511 budget increases at 10 US ecommerce brands, according to Sweat Pants Agency's research on a roughly $400M managed portfolio; for jumps of 30% or more, the lift peaks near +6.5% on days 6 to 9 and settles by days 10 to 14.
- Launch cadence does not scale with budget in the same data: accounts under $15K a week ran about 12 new ads per $10K of weekly spend, while accounts above $50K a week ran 0.6, because larger accounts feed proven winners instead of launching more.
- The top 10% of ads captured a median of about 75% of spend across 12 brands and 3,859 ads, per the same Sweat Pants Agency research.
- Cutting budget is not a clean reverse lever in the same Sweat Pants Agency research: only rare, large cuts of 30% to 50% lowered CAC at all, by 4% to 7%.
- Across Common Thread Collective's portfolio, Meta spend rose 25% year over year in Q1 2026 while ROAS fell only 3%, and Google ROAS rose 12% on 3.65% more spend.
What this means: In Sweat Pants Agency’s portfolio, a budget increase behaved like a fixed toll per move, directionally consistent in 8 of 10 brands. On that evidence, fewer and larger budget moves are no worse per dollar than frequent small ones and trigger fewer learning resets, and each move deserves the full 10-day window before it is judged. This per-move tax is separate from the slower erosion Optmyzr measured in Google accounts above $50K a month. At 9AM we have seen the ceiling hold far higher than most benchmarks suggest when creative supply keeps pace: EVRY Jewels held 7x+ return on ad spend while scaling to a $1M+ monthly paid media budget. Our guide to scaling paid media walks through the sequencing.
Paid Media Ad Spend as a Percentage of Revenue by Company Stage
Ecommerce brands spend between 7% and 35% of revenue on advertising, and the share should fall as revenue grows.
- Brands under $1M in revenue typically spend 25% to 35% of revenue on ads, falling to 20% to 30% at $1M to $5M, 15% to 25% at $5M to $10M, 12% to 20% at $10M to $25M, 10% to 18% at $25M to $50M, and 7% to 15% past $50M, per Eightx’s stage estimates drawn from its client base and aggregated industry data.
- 59% of ecommerce brands spend more than 30% of revenue on advertising, and most of those brands are unprofitable, per the same Eightx analysis.
- Additional ad spend tends to buy growth at a reasonable cost only up to about 20% to 25% of revenue for most categories, the point Eightx calls the efficient frontier, per the same Eightx analysis.
- At a $500K annual revenue store, the 25% to 35% range works out to roughly $10,400 to $14,600 in monthly ad spend, per Superscale's arithmetic on the Eightx ranges.
- Large enterprises budget just 7.8% of revenue for all of marketing in 2026, up from 7.7% in 2025, according to Gartner's survey of 401 CMOs, most at companies with over $1 billion in revenue.
- Paid media reached 31.4% of marketing expenses in the 2026 Gartner survey, a five-year high (up from 25.1% in 2021), and 53% of CMOs planned to invest more in paid media, as reported by Chief Marketer.
What this means: The Eightx ranges and the Gartner figure measure different things at different companies. Gartner’s 7.8% covers the entire marketing budget at mostly billion-dollar firms, while Eightx’s ranges cover paid media alone at DTC and CPG brands. The number to track is your own ratio over 12 months. Eightx reads a ratio that rises while revenue stays flat as a retention problem, which makes it a useful prompt to check repeat-purchase rates before cutting media. For how 9AM ties spend to margin, see contribution margin marketing.
Google Ads Benchmarks by Spend Tier: Mid-Market Leads on ROAS
Google Ads is getting more efficient per impression and less scalable at the same time.
- Mid-market Google Ads accounts ran about 50% higher ROAS than both SMB and enterprise accounts in Optmyzr's Q1 2026 data, as reported by Search Engine Journal, which also notes CTR rose from 1.83% to 2.22% while impressions fell about 11%.
- Optmyzr's full State of Google Ads Q1 2026 report explains the mid-market advantage as structural and traces Video campaign metric distortion to Google's migration of Video Action Campaigns into Demand Gen.
- Triple Whale's Google panel of 21,000+ brands reports a $28.14 median CPA, up 9.96%, with median CPM up 13.34% to $15.35 and median ROAS down 3.54% to 3.27, even as marketing efficiency ratio improved 3.73%.
What this means: Two separate trends are at work. Google’s available impression pool shrank about 11% year over year, which Optmyzr says makes scaling harder for every account, and mid-market accounts held their ROAS lead throughout, including the quarters before the drop. At the top tier, Optmyzr found enterprise CPA rising every quarter and attributes it to bidding at volume on competitive terms. Accounts at that level should plan spend increases against the return on the next dollar, which sits below the account average once returns diminish. For category-level Performance Max figures, see our Performance Max benchmarks.
Meta Ads Benchmarks by Spend Tier: CPM, ROAS and Ad Concentration
Meta still takes most ecommerce budgets, and its costs are rising faster than its returns.
- Meta's median CPM reached $15.06, up 13.24%, across more than 40,000 brands from August 2025 to July 2026, with median ROAS flat at 1.88, median CPA up 3.14% to $38.99, and 66.88% of tracked ad budgets going to Meta, according to Triple Whale.
- 16 of 17 industries saw Meta CPM rise year over year, with Health & Wellness the most expensive at $21.80, per the same Triple Whale report.
- Only about 5% of ads spend at least 10x their account's median, and roughly half of all ads get little or no spend, across 550,000+ ads from 6,000+ advertisers in Motion's 2026 Creative Benchmarks.
What this means: Rising CPMs have not translated one for one into higher acquisition costs: Meta’s median CPM and CPA rose, while median ROAS held flat. Within individual accounts, the Sweat Pants research found CPA flat across low, mid, and high CPM tiers. With spend this concentrated in a few ads, how quickly an account finds and funds its winners is one of the biggest efficiency levers on the platform. Our Meta advertising team builds media plans around that exact concentration to keep your CPAs in check.
Amazon Ads Benchmarks 2026: Costs Up, Returns Up
Amazon remains the highest-intent paid channel, and the price of that intent is rising fastest.
- Amazon's median CPM rose 39.18% to $8.08 across more than 2,800 brands from August 2025 to July 2026, while median ROAS improved 9.70% to 3.08, according to Triple Whale.
- Amazon posted an 11.02% conversion rate and the lowest CPA of any major ad platform in Triple Whale's 2025 Ecommerce Benchmarks Report, built on $18.4B in ad spend from 33,000+ brands.
- Amazon Sponsored Products conversion rate fell 7% year over year in Q3 2026 while cost per click dropped 3%, and Sponsored Brands conversion rate rose 20%, according to Pacvue’s Q3 2026 Commerce Media Benchmark Report.
What this means: The two Amazon datasets on this page point in different directions. Triple Whale’s August 2025 to July 2026 panel shows ROAS up despite a CPM increase, while Pacvue’s Q3 2026 data shows Sponsored Products conversion rate down 7%. The periods, ad types, and advertiser pools differ, so the figures do not cancel each other out, and the Pacvue number is the more recent signal. Track conversion rate by ad type each quarter, since Sponsored Products and Sponsored Brands moved in opposite directions in Q3.
Further reading: For retail media beyond Amazon, see our Walmart Connect playbook.
Paid Media CPM Benchmarks 2026: What Reach Costs on Each Platform
CPM is the cheapest metric to compare across platforms and the easiest to misread.
- TikTok ads cost a median $4.07 per thousand impressions for Triple Whale customers from October 2025 to September 2026, against $15.48 on Meta and $15.93 on Google, across $962.54M of tracked TikTok spend.
- TikTok's median CPA came in at $17.07 on TikTok across 5,900+ brands in Triple Whale's TikTok benchmarks, less than half of Meta's $38.99, though TikTok's lower ROAS means those customers also return less revenue per dollar.
- Prospecting CPMs for DTC brands typically run $12 to $22 on Meta, $6 to $12 on TikTok, $8 to $15 on YouTube, and $25 to $45 on connected TV, with Q4 running 30% to 60% above median, per Top Growth Marketing's portfolio of 200+ DTC accounts.
- The US producer price index for internet advertising sales stood at 122.5 in December 2025 against a December 2022 base of 100, a 22.5% rise in three years, per US Bureau of Labor Statistics data published by FRED.
What this means: CPM measures the price of reach; customer cost depends on what happens after the impression. TikTok shows the gap clearly: its median CPM is about a quarter of Meta’s, its median CPA is a little under half, and its median ROAS is lower (1.51 against 1.88). Sweat Pants’ explanation for flat CPA across CPM tiers is that cheaper impressions usually come from broader, lower-intent audiences. Compare platforms on CPA and incremental return. Our TikTok vs Meta comparison covers where each wins on creative.
Paid Media Channel Mix Benchmarks: How Budgets Split at Each Tier
Small advertisers run a two-channel mix; large advertisers diversify, but Meta stays dominant at every tier.
- Brands spending under $50K a quarter split budgets roughly 50/40 Meta/Google with nothing else, while brands above $1.5M a quarter put 59.0% into Meta acquisition, 23.4% into Google non-brand, 8.6% into Google brand, and 2.6% into TikTok, across 299 DTC brands and $231M of Q1 2026 spend analyzed by Common Thread Collective.
- TikTok only appears in budgets at the $500K-per-quarter tier and up (2.6% of spend), and Meta retargeting barely exists below $150K a quarter, per the same Common Thread Collective benchmark.
- Google brand search reported 19.07x ROAS but delivered 5.72x after incrementality adjustment, while Meta acquisition was understated (1.83x reported vs 2.07x incremental), per the same Common Thread Collective benchmark.
- TikTok sits at 2.3% of the median DTC ad budget, but beauty brands see TikTok ROAS around 3.5x against 1.57x on Meta, which supports a 20% to 25% TikTok allocation in that category, per Eightx.
- Digital media now represents more than two-thirds of total media investment, up 18% since 2024, and awareness plus conversion take 62.6% of media spend, according to Gartner's 2026 CMO Spend Survey.
- Loyalty and retention fell to under 15% of media spend, a 29% decline, according to ContentGrip's coverage of Gartner's 2026 CMO Spend Survey.
- In B2B, Meta's share of paid budgets rose from 20.8% to 24.9% while Google's fell from 43.6% to 40.9%, per GTM Strategist's 2026 analysis.
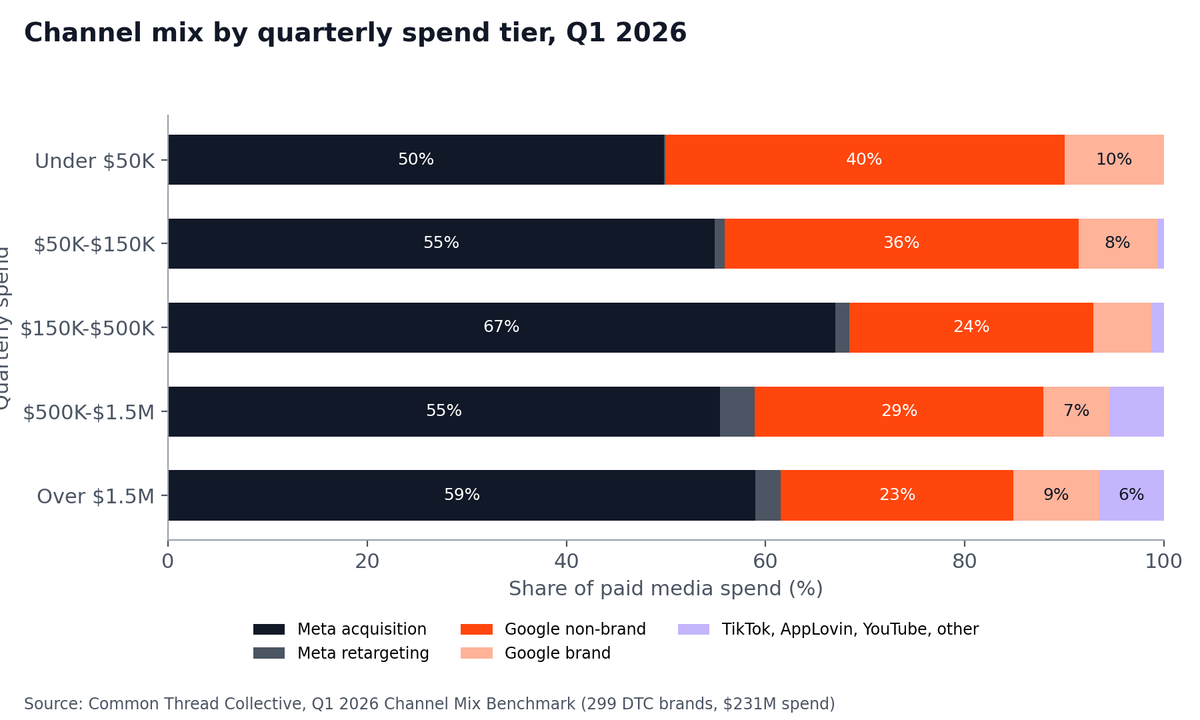
What this means: Our read on why small budgets concentrate: each channel needs enough conversions to exit its learning phase, and Meta’s guidance is roughly 50 optimization events per ad set per week. A brand spending under $50K a quarter usually has to pool its conversions in one or two channels to clear that bar. Our media buying team sequences channel additions with that threshold in mind.
Creative Testing Budget Benchmarks by Spend Tier
Creative volume rises steeply with spend, and so does the share of budget that winning ads absorb.
- Accounts spending under $10K a month on Meta launch a median 2.8 new creatives per week, rising to 4.1 at $10K to $50K, 6.7 at $50K to $200K, 11.2 at $200K to $1M, and 18.9 at $1M+, while average hit rate climbs from 4.0% to 8.8%, per Motion's 2026 Creative Benchmarks.
- Winning ads take about 23% of spend in the smallest accounts and about 64% in the largest, per the same Motion benchmarks.
- Accounts spending $100K to $500K a month should push 10 to 15 variants through testing each week, with 10% to 20% of channel spend on testing, per Foxwell Digital guidance compiled by Superscale.
- Primer's rule of thumb is 50 new ads for every $25,000 in monthly ad spend.
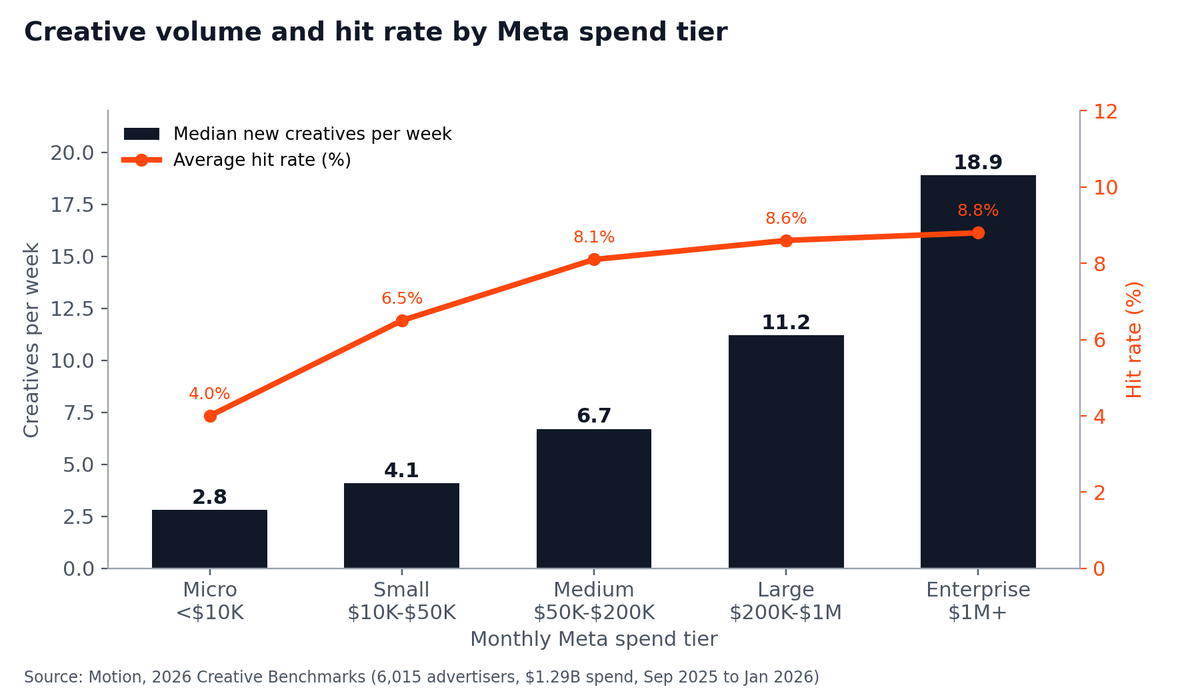
What this means: Two benchmarks matter here: your weekly output against your tier’s median, and your hit rate against Motion’s 4.0% to 8.8% range. Motion cautions that a high hit rate on low volume can signal too little testing, although across tiers the largest advertisers posted both the most creatives and the highest hit rates. At 9AM, sustained creative supply is what moved the needle for Genomelink: 70 unique assets a month across six formats contributed to a 77% CAC reduction over three years. Our creative testing guide covers refresh cadence.
ROAS vs MER vs Incrementality: Measuring Efficiency Honestly
Every benchmark on this page depends on how it was measured, and platform-reported ROAS is the least comparable number in paid media.
- Facebook acquisition campaigns posted a median iROAS of 1.14 across 45 stores in Common Thread Collective’s geo-holdout test database, while Google branded search posted 0.27 across 39 stores.
- Across 225 incrementality tests on DTC brands, Stella measured a 2.31x median incremental ROAS, with the middle half of results between 1.36x and 3.24x, according to Stella’s co-founder.
- Meta redefined "click" for attribution on March 18, 2026, and Common Thread Collective recommends a 13% haircut to existing 7-day click ROAS targets to keep them comparable.
- ROAS multiplied by cost per purchase equals average order value, which explains why a 2.96 panel median ROAS on 15 managed DTC brands sits so far above Triple Whale's 1.88: the managed panel's implied order value is $145 against $73, per Top Growth Marketing.
- Meta customer acquisition cost reads $38 to $58 as platform-reported CPA but $212 to $230 as fully loaded channel CAC, per Eightx's channel benchmarks.
What this means: Compare your ROAS to a benchmark only after checking three things: the attribution window, the order value, and how much of the reported revenue is incremental. Brand search is the clearest case in this data: in Common Thread Collective’s Q1 2026 benchmark it kept less than a third of its reported return, and the firm’s test database puts its median incremental ROAS at 0.27. Our geo-lift testing guide covers how to measure incrementality for your own account.
How to Use These Paid Media Benchmarks for Your Spend Tier
- Place yourself in the right tier. Use monthly paid media spend for platform benchmarks and annual revenue for CAC and ad-spend-ratio benchmarks; they answer different questions.
- Calculate break-even first. Divide 1 by your gross margin to get break-even ROAS, then read every benchmark against that line.
- Adjust for incrementality. Discount brand search and retargeting ROAS before comparing them with prospecting channels.
- Benchmark creative output. Compare weekly launches and hit rate against your tier's median before blaming the auction.
- Scale in deliberate steps. Budget for a 5% to 6% CAC bump per increase and give each move about 10 days.
- Re-check quarterly. CPMs moved double digits in a single year; a benchmark from last year's plan is already stale.
9AM builds paid media programs around these numbers for brands from growth stage to $1M+ monthly budgets. Book a strategy call to see where your account sits against your tier.
How We Sourced These Statistics
Neither IAB, Nielsen, Kantar, the Big Four nor the platforms themselves publish efficiency broken out by how much an advertiser spends.
As such, this page draws on platform-measured datasets from analytics vendors (Triple Whale, Optmyzr, Motion, Polar Analytics via Eightx), agency research with stated samples (Common Thread Collective, Sweat Pants Agency), industry surveys (Gartner), government price data (US Bureau of Labor Statistics), and named secondary reporting.
Vendor and agency research is labeled as such, and Eightx’s revenue-stage figures are labeled as the firm’s own estimates.
Every statistic was published in 2025 or 2026, and figures are cited exactly as published. Most datasets skew toward US direct-to-consumer ecommerce; B2B figures are limited and labeled.
Frequently Asked Questions
Why do mid-market Google Ads accounts earn higher ROAS than enterprise accounts?
Larger accounts bid deeper into competitive auctions, so each additional impression costs more and converts less. Mid-market accounts have enough budget to win strong placements without paying for the marginal ones. That’s why, in Optmyzr's Q1 2026 data, accounts spending $10K to $50K a month earned 565.8% ROAS against 377.3% for $50K+ accounts.
At what spend level does incrementality testing become worthwhile?
Once a brand runs meaningful brand search or retargeting budgets, the gap between reported and incremental ROAS is large enough to change decisions. Common Thread Collective found brand search delivering under a third of its reported return. Geo-holdout tests need enough regional volume to read, which generally favors brands with steady, sizable monthly spend.
When should a brand add a new paid media channel?
Add a channel once the budget can fund it past its learning phase without starving the channels that already work. Smaller advertisers in Common Thread Collective’s data run almost entirely on Meta and Google, and channels like TikTok and YouTube only show up in budgets above roughly $500K a quarter. A new channel needs enough conversion volume to optimize, so test it with a dedicated budget and judge it on incremental return.
Why do paid media benchmarks differ so much between sources?
Each source measures a different set of advertisers with a different attribution setup. Panels built from tens of thousands of small brands report lower medians than agency-managed portfolios, and order value moves ROAS on its own: a brand with a $145 average order can post a higher ROAS than a $73 brand on identical media buying. Check who is in the sample before comparing your numbers to it.