Digital Coupon Marketing for Food Brands: Measure Redemption
Digital coupon marketing for food brands: the coupon types, the metrics that prove sales, and eight steps to measure redemption and incremental lift.

· 17 min read
Total coupon distribution fell to 34 billion in 2025 from 53.1 billion the year before, while redemptions fell only about 7%, to roughly 0.81 billion. Each offer now carries more weight, so the question is: did the coupon sell units that would not have sold at full price?
This guide covers the coupon formats food brands fund, the metrics that separate loads from real sales, and a step-by-step way to plan and measure each offer.
P.S. If you want coupons, retail media and paid social planned against the same sales goal, our CPG media buying team builds that plan with you.
A coupon is a media buy with a discount attached. It reaches a chosen audience, it costs money per result, and it should answer to the same incremental-sales test as a retail media campaign. That is why, at 9AM, we read coupon results next to ad results, in one report, by retailer. Loads tell you interest. Redemptions tell you activity. Only the comparison with shoppers who never saw the offer tells you growth.
What Is Digital Coupon Marketing for Food Brands?
Digital coupon marketing is the practice of funding discounts that shoppers load or claim on a phone, app or website and that apply automatically at checkout.
Because the offer is delivered and redeemed digitally, it brings several advantages: encouraging shoppers to try a new product, reaching them when they’re ready to buy and making it easier to track how many offers are used.
Depending on the platform, you may also be able to see which retailers or shopper groups responded and use those insights to plan your next campaign.
Those insights depend on who handles the offer along the way. For a food brand, the coupon is usually a manufacturer offer that a retailer or app delivers on the brand's behalf.
The money moves in a fixed order:
The brand funds the offer and sets its terms.
A retailer app, coupon app or ad platform distributes it.
The shopper loads it to a loyalty account or claims it.
The discount applies at checkout, in store or online.
The retailer is reimbursed through a clearing agent or the platform.
The brand pays for the redeemed discounts plus handling and platform fees.
Every step after the first produces data. Paper coupons gave brands a redemption count weeks later. Digital offers, by contrast, can show who saw the offer, who loaded it, where they redeemed it and what else they bought.
Why Grocery Coupons Have Moved to Digital Channels
Grocery coupons moved to digital because shoppers now redeem them through retailer loyalty apps. In fact, load-to-card offers accounted for 53.9% of all redemptions in 2025, according to Inmar Intelligence, while free-standing inserts contributed 2.3%.
Three shifts sit behind that number:
Retailers own the offer channel. Grocers fold manufacturer offers into their loyalty programs, so the discount follows the shopper from the app to the lane, pickup and delivery.
Brands distribute less and target more. The drop from 53.1 billion to 34 billion distributed coupons with steady redemptions points to smaller, aimed offers.
Retail media and offers now share data. Kroger, for example, runs retail media, consumer insights and loyalty marketing under Kroger Precision Marketing.
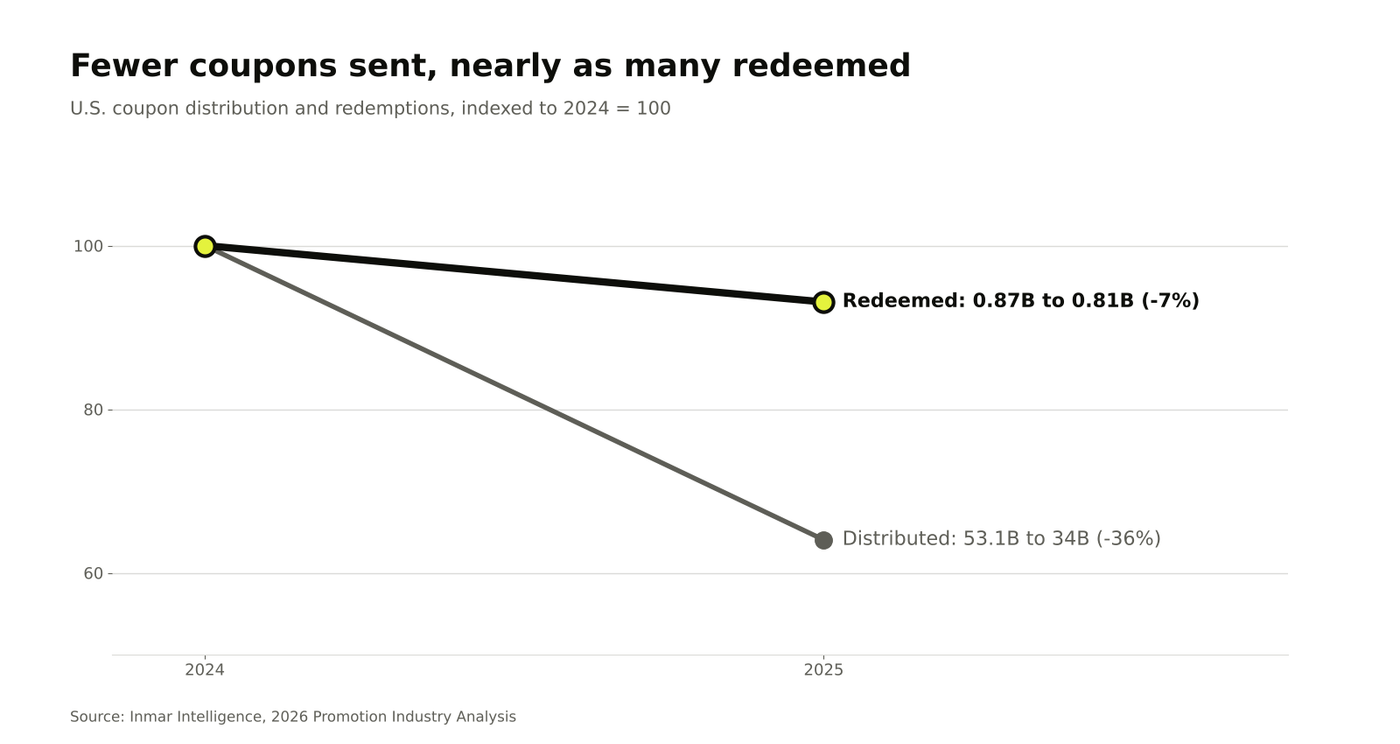
Coupon distribution fell 36% from 2024 to 2025 while redemptions fell 7%. Source: Inmar Intelligence.
For marketers, this means the coupon now lives inside the same retailer systems that sell ad inventory. That makes joint planning possible, and it makes sloppy measurement easier to spot. Coupons are one part of a wider shift in CPG digital marketing toward retailer data and sales that brands can measure.
Types of Digital Coupons Food Brands Use
Food brands fund five main digital coupon formats. Each one reaches a different shopper and returns a different kind of data, which decides how far you can measure it.
Load-to-Card Offers in Retailer Apps
Shoppers clip the offer in a grocer's app or mobile wallet, and it applies when they scan their loyalty number. Kroger, Albertsons and Target run large programs. The retailer holds the shopper data and shares results through its media or insights team.
Cash-Back Offers in Coupon Apps
Apps such as Ibotta and Fetch pay shoppers after a verified purchase, through a linked loyalty account or a scanned receipt.
The brand pays per verified redemption.
Receipt scanning also gives brands purchase data across retailers, which is why General Mills runs its Good Rewards program for more than 40 brands on Fetch.
Digital Coupons on Amazon, Walmart and Instacart
Marketplace and delivery platforms sell coupons alongside their ads. On Amazon, a coupon costs $5 per coupon created plus 2.5% of coupon sales, with that 2.5% fee capped at $2,000 per coupon.
The discounts themselves come out of a separate coupon budget and must sit between 5% and 50% of the product's price.
On Instacart, coupons can run next to sponsored placements, so the stock, margin and promotion checks for an Instacart campaign apply to the offer too.
Printable and Code-Based Coupons From Brand Channels
Brands still publish printable offers and coupon codes through their own sites, email and SMS.
These reach existing fans cheaply. However, they also carry the highest risk of misredemption and sharing, so set limits per household and an expiry date.
Coupons Distributed Through Paid Social and Creators
Paid social and creator posts can point shoppers to a retailer load or an app offer. The ad drives reach; the retailer or app records the redemption. Plan this format with both reports in hand, or the social campaign will claim sales it cannot prove.
Coupon type | Who distributes it | Data the brand gets back | Typical cost model |
|---|---|---|---|
Load-to-card | Retailer app | Loads, redemptions, retailer-level sales | Face value plus clearing and retailer fees |
Cash-back app | Ibotta, Fetch | Verified purchases, cross-retailer baskets | Face value plus a per-redemption fee |
Marketplace coupon | Amazon, Walmart, Instacart | Clips, coupon sales, ad-attributed sales | Platform fee plus face value |
Printable or code | Brand site, email, SMS | Code uses, limited shopper data | Face value plus clearing |
Social or creator | Meta, TikTok, creators | Ad clicks, plus redemptions from the partner | Media cost plus face value |
Digital Coupon Metrics Food Brands Should Track
Digital coupon metrics run from reach to incremental sales, and each one proves more than the one before it. Track all six, but judge the offer on the last two.
Offer Impressions and Reach
Reach counts the shoppers who saw the offer in an app, a feed or an ad. It tells you whether the targeting worked, but it tells you nothing about sales.
P.S. Already running offers at several grocers? We fold them into the same media plan and read them every quarter next to your retail media results.
Clips and Card Loads
A clip or load means a shopper saved the offer. It signals interest, and many loads never redeem. Report loads as an intent metric only, though you should never use it as a result.
Redemptions and Redemption Rate
A redemption records an offer being used.
Depending on the offer and the platform, one redemption may cover one unit, several units or a qualifying basket, so check the platform's definition before you compare redemptions with units sold.
Redemption rate divides redemptions by loads, by shoppers reached or by coupons distributed, and the three versions give very different numbers. State the denominator every time you report a rate.
Cost Per Redemption, Including Clearing and Platform Fees
Cost per redemption is the total cost of the offer divided by the number of redemptions.
That total includes the value of every discount shoppers used, plus clearing or handling charges and platform fees.
On Amazon, for example, add the $5 coupon fee and the 2.5% fee on coupon sales to the value of the discounts. If paid media promoted the offer, report that cost too, either in the total or next to it.
Incremental Units and the Post-Promotion Dip
Incremental units are the extra units sold because of the offer, compared with what shoppers would have bought anyway.
That comparison matters because a spike during the offer can hide sales borrowed from the weeks after it.
Circana warns that a promotion with a 12% in-window bump can net zero incremental annual sales once the slump after the promotion is counted.
A deal on one pack size can also pull volume from the brand's other sizes.
New-to-Brand and Repeat Buyers
New-to-brand buyers show whether the offer grew the customer base.
Offers can reach those shoppers.
For example, in a Circana meta-study of 48 Ibotta campaigns, published by Ibotta, offers lifted incremental sales by 26.9% among shoppers who had not bought the category in the past 52 weeks and by 32.9% among recent buyers of competing brands.
Pro tip: Track whether those buyers return at full price in the following months; that is where brand loyalty shows up.
Metric | Where it comes from | What it proves | What it cannot prove |
|---|---|---|---|
Impressions and reach | App, retailer or ad platform | The offer reached the target shoppers | Any purchase |
Clips and loads | Retailer app, coupon app | Shoppers showed interest | That they bought |
Redemptions | Clearing agent, retailer, app | Discounted purchases happened | That they would not have happened anyway |
Cost per redemption | Your finance team plus fee reports | What each redemption cost | Profitability |
Incremental units | Holdout or matched-store test | Sales the offer actually created | Long-term loyalty on its own |
New-to-brand and repeat | Retailer or app purchase data | Customer growth and retention | Margin per customer without a cost view |
How to Build a Digital Coupon Marketing Strategy Step by Step
Build a digital coupon strategy by deciding the job first and the measurement second, then setting terms, promotion and data collection around both. The eight steps below run in order.
1. Set the Coupon's Job: Trial, Repeat Purchase or Volume Defense
Give each offer one job.
Trial offers target shoppers who have not bought the brand or category.
Repeat offers target recent first-time buyers.
Volume defense targets current buyers when a competitor discounts.
The job decides the audience, the discount depth and the metric. A trial offer that mostly reaches current buyers has failed, even if redemptions look strong.
2. Choose Retailers and Coupon Platforms Your Distribution Supports
Run offers only where the product is on shelf in enough stores to meet demand. A coupon in a retailer where you have thin distribution creates frustrated shoppers and wasted fees.
Then, rank retailers by stores carrying the item, sales per store and the data the retailer shares back. The same check applies when you choose a grocery retail media network, so one distribution review can cover both the offer and the ads.
3. Set Discount Depth, Purchase Requirement and Expiry Date
Match the discount to the product's price, because price affects how many shoppers act on the offer.
In Social Nature's 2024 analysis of 133 digital rebate campaigns, products priced $5 to $10 redeemed best, and the company recommends bundling $2 to $4 items to reach that range.
Then set the rules:
Depth: enough to change a decision, usually a share of shelf price you can afford across every redemption.
Purchase requirement: one unit for trial, multiples only for volume jobs.
Expiry: a limited time window, long enough to cover one shopping cycle for the category.
Limits: one redemption per household for trial offers.
4. Record a Sales Baseline Before the Offer Goes Live
Pull at least 8 to 12 weeks of store-level sales for the promoted items and their sister sizes.
Note seasonality, price changes and new distribution.
Without a baseline, the spike during the offer has nothing to compare against.
5. Promote the Coupon with Paid Media and Retail Media
An offer nobody sees, nobody can redeem.
Promote it inside the retailer's ad network, such as Walmart Connect, in paid social and with creators, and name the retailer and the saving in the creative.
That promotion also shapes what the test in step 7 can prove, so decide before launch what you want it to measure.
To estimate the coupon's own effect alongside paid media:
Give the test and control groups comparable access to the ads.
Withhold only the coupon from the control group, where the platform allows it.
If only the test group receives both the ads and the offer, the result reflects their combined effect.
Set up the groups with the retailer or measurement partner before launch.
6. Pull Redemption Data From the Clearinghouse and Each Platform
Collect redemptions, loads, fees and sales from every source into one sheet, by retailer and by week. Many retailers and apps now report close to real time; clearing data arrives later.
Use the same date range and the same attribution window for every source. Mixed windows are a common reason two reports disagree, because each platform applies its own default attribution window.
7. Measure Incremental Lift with a Holdout Group or Matched Stores
Compare shoppers or stores that got the offer with similar ones that did not. Two methods work for food brands:
Holdout audience: the retailer or app withholds the offer from a random share of eligible shoppers.
Matched stores: a control group of comparable stores, either held back or modeled from history. Circana's Liquid Testing builds that control from point-of-sale data covering more than 750,000 stores.
Extend the read four to eight weeks past the offer's end to catch the post-promotion dip. If the retailer cannot hold out shoppers or stores, a geo-lift test across matched markets can estimate the same incremental effect.

Illustrative weekly sales: a four-week offer spikes units, then sales dip below baseline for several weeks. Source: 9AM illustration based on Circana.
8. Renew, Change or End the Offer Based on Cost Per Incremental Unit
Divide the full cost of the campaign by the units it actually added:
Cost per incremental unit = Total campaign cost ÷ Incremental units |
|---|
For a simplified example, let’s imagine the only costs are a $1 discount and $0.15 in fees per redemption.
If shoppers redeem 20,000 coupons, the offer costs $23,000.
If a holdout test estimates 6,000 incremental units, each incremental unit cost $3.83.
Add fixed fees and paid media costs if they were part of the campaign.
Next, compare that figure with the margin per unit and with your cost per incremental unit from retail media:
Renew offers that beat both.
Change the depth, audience or retailer for offers close to break-even.
End the rest.
Digital Coupon Redemption Rate Benchmarks for Food Brands
Redemption rate benchmarks for food coupons only compare when they share a denominator. Industry-wide, about 0.81 billion redemptions on 34 billion distributed coupons works out to roughly 2.4%, our calculation from the Inmar figures above.
That figure covers every coupon format, paper and digital, and divides one year's redemptions by one year's distribution, so treat it as a rough guide.
Platform benchmarks look very different.
In its 2024 analysis of 133 digital rebate campaigns, Social Nature reported an average main-offer redemption rate of 52%, with beverages, pantry staples, snacks and frozen foods between 49% and 56%.
Note: These are results from Social Nature campaigns only, so confirm how each platform calculates its rate before you compare it with your own.
Benchmark | Denominator | Figure | Source |
|---|---|---|---|
All U.S. coupons, 2025 | Coupons distributed | About 2.4% | Our calculation from Inmar |
Digital rebate campaigns | Not specified in the published analysis | 52% | Social Nature |
Food categories on rebates | Not specified in the published analysis | 49% to 56% | Social Nature |
Use benchmarks to sanity-check, then judge each offer on its own incremental units.
How Digital Coupon Budgets Fit with Retail Media and Trade Spend
Digital coupons usually sit in the trade or promotion budget, while retail media sits in the marketing budget, even when both run at the same retailer.
That accounting split decides which budget pays for each retail campaign.
It should not decide how results are read: report both together, by retailer, on cost per incremental unit.
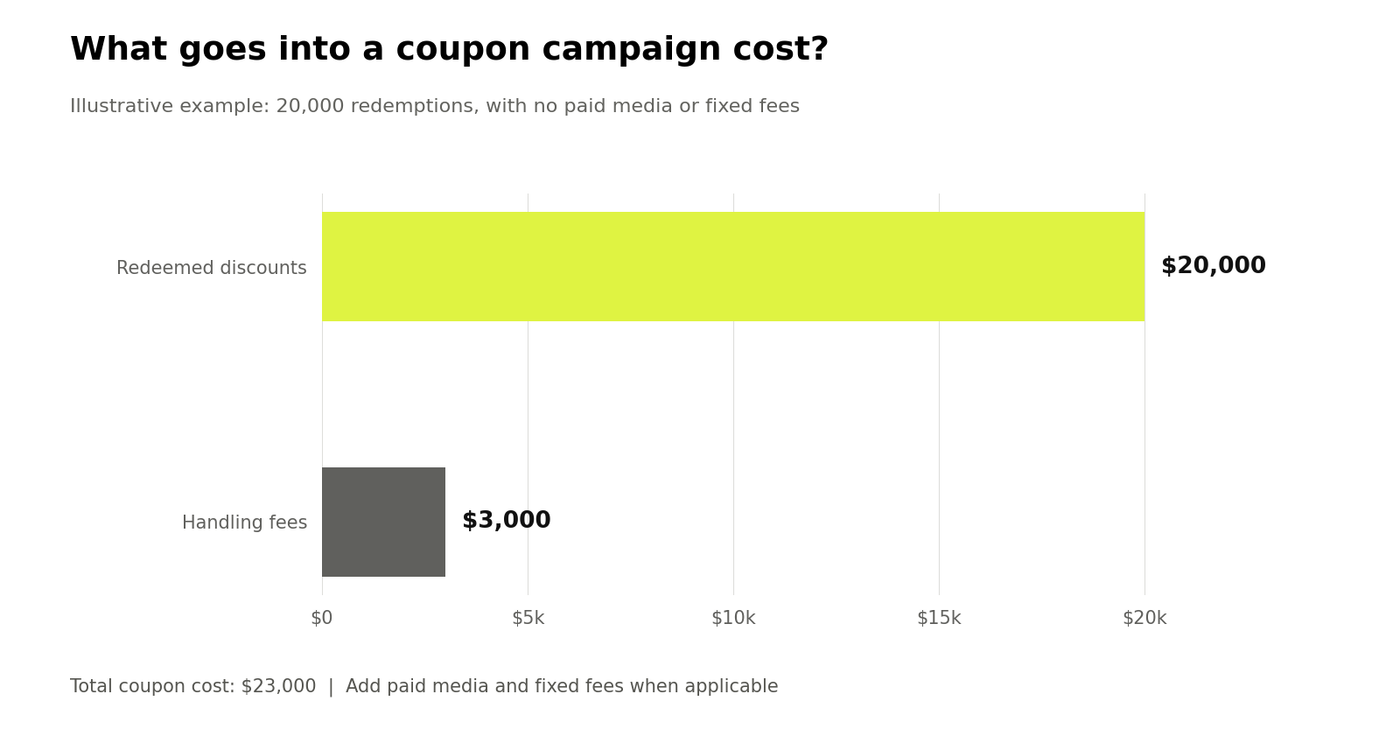
Illustrative coupon campaign cost: $20,000 in redeemed discounts plus $3,000 in handling fees. Paid media and fixed fees would be additional. Source: 9AM example.
That shared view:
Shows when a retail media campaign does the job of a coupon at lower cost, and when an offer brings new buyers that ads by themselves did not.
Stops two teams from paying for the same sale.
Running both well also depends on execution, which is where many brands struggle: in the Promotion Optimization Institute's 2025 State of the Industry report, 61% of CPG manufacturers surveyed said their companies had difficulty executing planned promotions.
If those budgets sit with different teams at your brand, 9AM can plan retail media for food brands alongside the offer calendar.
Common Digital Coupon Marketing Mistakes Food Brands Make
Reporting loads as results. Loads show interest. Count redemptions and incremental units instead.
Paying loyal buyers who would buy anyway. Broad offers to current buyers discount sales you already had. Target by purchase history.
Stacking with retailer discounts nobody agreed to fund. Agree on stacking rules before launch, or one sale can carry two discounts.
Ignoring the post-promotion dip and cannibalization. Read sales four to eight weeks after the offer and across every pack size.
Running offers where stock is thin. Check stores carrying the item and on-shelf rates first; empty shelves turn paid redemptions into lost sales. Separate distribution gains from units sold per store first, so a stock problem is not blamed on the offer.
Digital Coupon Marketing Trends for 2027
Four changes shape digital coupon marketing trends for 2027:
Smaller, targeted distribution. The fall to 34 billion distributed coupons points to fewer, aimed offers with stronger reporting.
Receipt-scan loyalty. Food manufacturers build direct shopper data through apps such as Fetch, since they do not own the checkout.
Private label pressure. Store brands reached a record 21.3% dollar share in 2025, per PLMA data, which raises the stakes for trial offers.
Offers inside AI shopping tools. At Groceryshop 2026, Kroger, Giant Eagle and DoorDash described AI assistants that build shopping baskets, which could become a new place to surface brand offers.
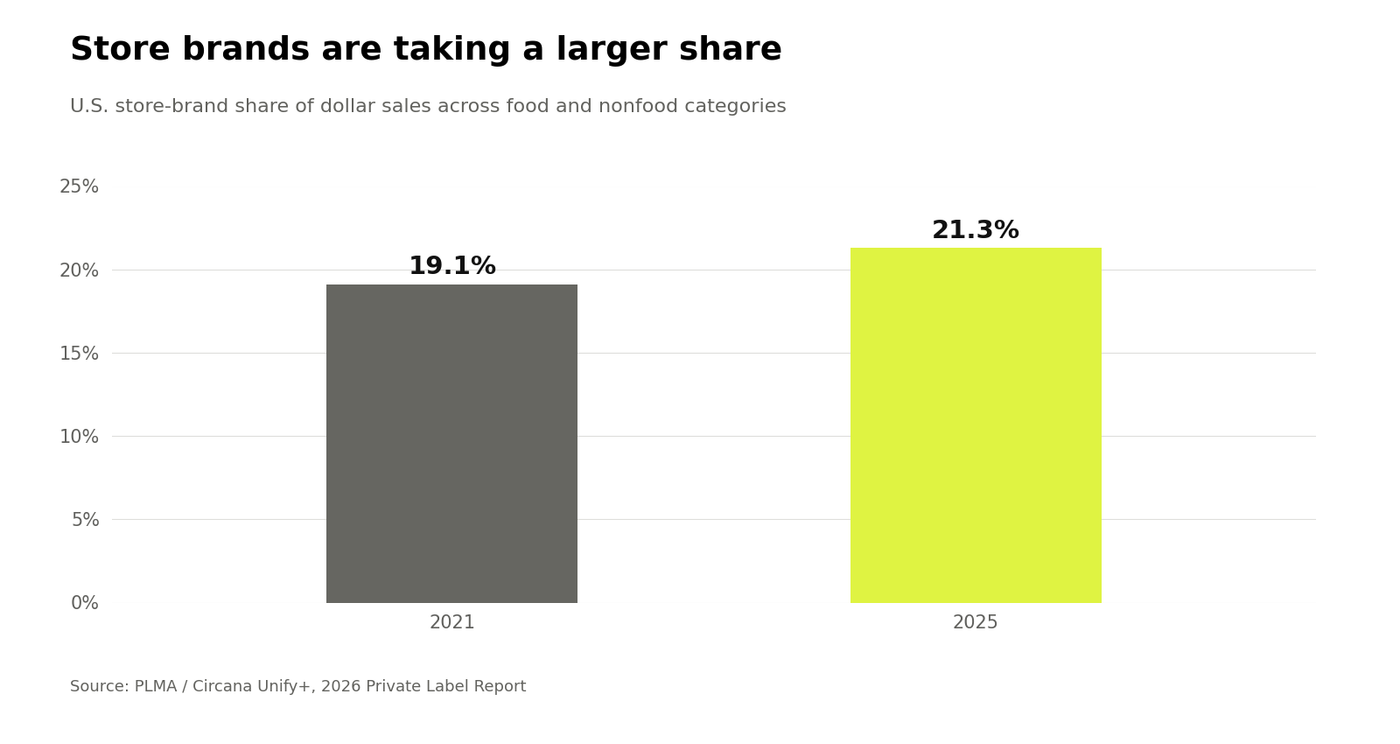
U.S. store-brand dollar share rose from 19.1% in 2021 to 21.3% in 2025, across food and nonfood categories. Source: PLMA and Circana Unify+
What this means for you: You have more ways to get an offer in front of shoppers, but each one comes with its own costs and reporting. Before you add a new app or retailer program to your coupon plan, decide what you want the offer to do: win shoppers from a competitor, encourage a first purchase or bring existing buyers back.
Then check what the platform can tell you about those shoppers and whether you can measure incremental sales. A new channel may bring plenty of redemptions, but you still need to know how many of those purchases would have happened without the discount.
Turn Coupon Redemption Data Into a Growth Plan
The brands that get the most from coupons treat each offer as a test with a control group. They pick one job per coupon, read the result in incremental units, and move money between offers and retail media based on what each unit cost.
Start with your next planned offer: write down its job, its denominator and its holdout before it launches. Then keep that discipline for every offer after it, so each quarter's plan builds on what the last one proved.
Book a strategy call with 9AM to plan coupons, retail media and paid social against one sales goal, quarter after quarter.
Frequently Asked Questions
What is a good digital coupon redemption rate?
There is no single rate that works for every coupon campaign. Inmar's 2025 figures imply roughly 2.4 redemptions per 100 coupons distributed across all formats, paper and digital. Social Nature reported a 52% average main-offer redemption rate across 133 digital rebate campaigns, but its published analysis does not say what that rate is divided by. Check how each rate is calculated before you compare results; the number that decides renewal is cost per incremental unit.
Who pays for a digital coupon, the brand or the retailer?
For a manufacturer coupon, the brand pays the face value and the handling fees, and the retailer is reimbursed after the sale. Retailers fund their own store coupons. Set stacking rules in advance so a sale does not carry both.
How long should a digital coupon offer run?
Run it long enough to cover at least one purchase cycle for the category, usually two to four weeks for pantry staples and snacks. Shorter windows miss slower shoppers. Longer windows tend to discount purchases that would have happened anyway.
Do digital coupons reduce full-price sales?
They can. A promotion may pull purchases forward and cause a dip below baseline afterward, and a deal on one size can take sales from another. A holdout test read for several weeks after the offer shows whether full-price sales fell.
About Corentin Grisoni
Corentin Grisoni helps DTC and wellness brands turn paid media into a connected growth system. As Retail Media Lead at inBeat Agency, he works across Amazon, Meta, TikTok, and Google to build omnichannel campaigns that are measurable, scalable, and tied to business outcomes.
His work brings together retail media strategy, paid social and search, attribution modeling, UGC, and performance creative. He focuses on helping retail, technology, and wellness brands understand where their media budget is working and create a system that compounds what performs.
More from Corentin Grisoni